MainIndicatorsonEconomicEfficiency项目Item20002004200520062007OverallLaborProductivity2287832281356763972946655(yuan/person)RatioofImputtoTotalOutput(%)61.961.461.461.861.6第一产业PrimaryIndustry38...

单位:亿元年份地区生产总值第一产业第二产业第三产业工业建筑业195212.738.392.422.170.251.92102195722.0312.315.204.230.974.52154196222.1210.265.124.001.126.74137196528.8113.488.316.551.767.02166197034...

项目20002004200520062007228783228135599397264665261.961.461.461.761.6第一产业38.239.539.740.140.8第二产业73.572.372.172.372.3工业73.972.272.272.772.8建筑业70.973.171.468.268.2第三产业44.238.834.239...

项目20002005200620072008228783559939726466525285861.961.461.761.662.6第一产业38.239.740.140.841.1第二产业73.572.172.372.372.8工业73.972.272.772.873.2建筑业70.971.468.268.270.0第三产业44.234.239.238...

项目20002005200820092010201122878355995285857602668287469961.961.462.662.362.163.2第一产业38.239.741.140.940.941.0第二产业73.572.172.872.871.772.6工业73.972.273.273.372.473.0建筑业70.971.470.070.067.569.7第三产业44.234.241.639.441.442.547.246.654.854.455.756.3批发和零售业44.022.928.827.728.630.338.138.637.437.737.936.8第一产业61...

项目20002005200720082009228783559946652528585760261.961.461.662.662.3第一产业38.239.740.841.140.9第二产业73.572.172.372.872.8工业73.972.272.873.273.3建筑业70.971.468.270.070.0第三产业44.234.238.141.639.447.246.646.054.854.4批发和零售业44.022.919.928.827.738.138.638.437.437.7第一产业61.860.359.258.959.1第二产业26.527.927.727.227....

项目20002005200820102011228783559952858668287469961.961.462.662.163.2第一产业38.239.741.140.941.0第二产业73.572.172.871.772.6工业73.972.273.272.473.0建筑业70.971.470.067.569.7第三产业44.234.241.641.442.547.246.654.855.756.3批发和零售业44.022.928.828.630.338.138.637.437.936.8第一产业61.860.358.959.159.0第二产业26.527.927.228.327....

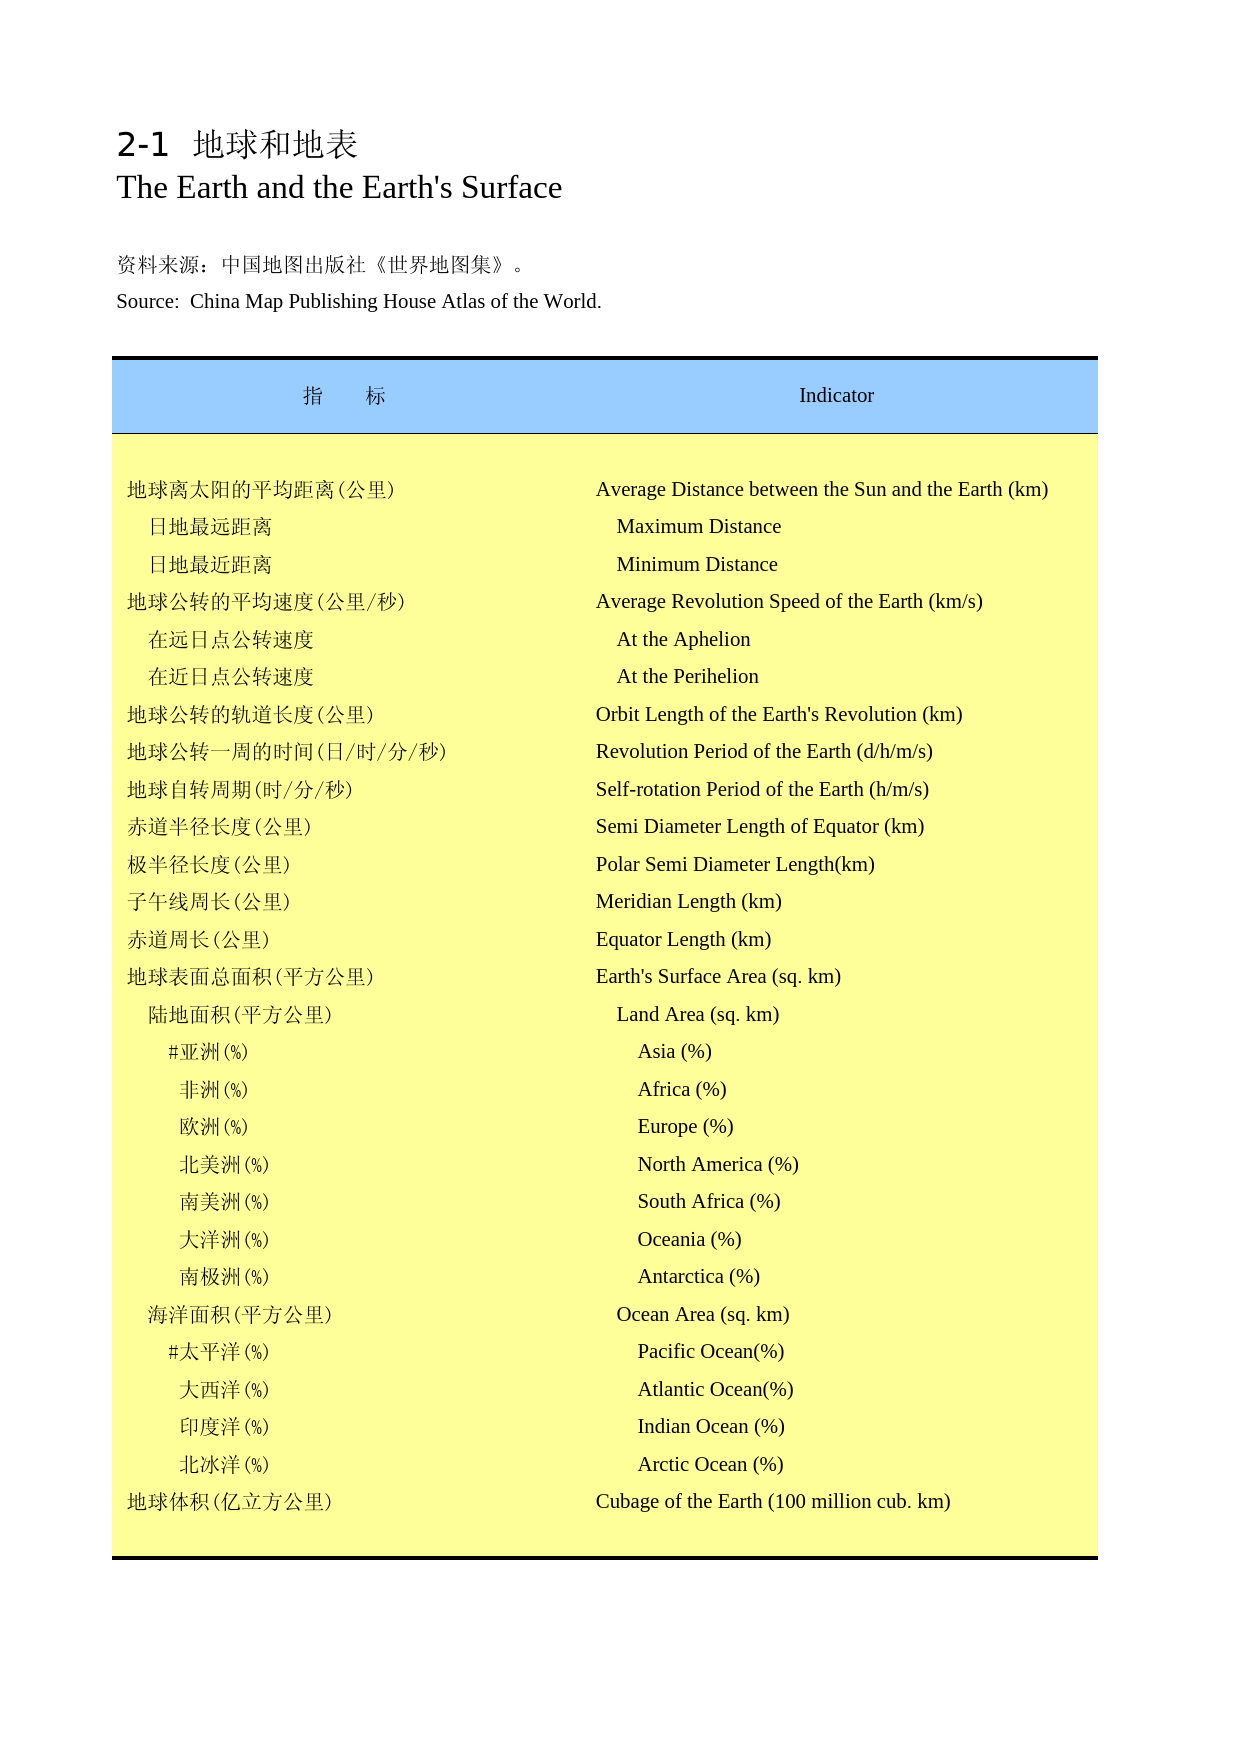
TheEarthandtheEarth'sSurface资料来源:中国地图出版社《世界地图集》。Source:ChinaMapPublishingHouseAtlasoftheWorld.指标IndicatorAverageDistancebetweentheSunandtheEarth(km)日地最远距离MaximumDistance日地最近距离MinimumDistanceAverageRevolutionSpeedoftheEarth(km/s)在远日点公转速度AttheAphelion在近日点公转速度AtthePerihelionOrbitLen...

TheEarthandtheEarth'sSurface资料来源:中国地图出版社《世界地图集》。Source:ChinaMapPublishingHouseAtlasoftheWorld.指标IndicatorAverageDistancebetweentheSunandtheEarth(km)日地最远距离MaximumDistance日地最近距离MinimumDistanceAverageRevolutionSpeedoftheEarth(km/s)在远日点公转速度AttheAphelion在近日点公转速度AtthePerihelionOrbitLen...
TheEarthandtheEarth'sSurface资料来源:中国地图出版社《世界地图集》。Source:ChinaMapPublishingHouseAtlasoftheWorld.指标IndicatorAverageDistancebetweentheSunandtheEarth(km)日地最远距离MaximumDistance日地最近距离MinimumDistanceAverageRevolutionSpeedoftheEarth(km/s)在远日点公转速度AttheAphelion在近日点公转速度AtthePerihelionOrbitLen...

CountryAreaandPopulationDensitySource:WorldBankWDIDatabase.国家和地区CountryorArea20092000世界World13412.247.0中国China960.0135.4中国香港HongKong,China0.16396.4中国澳门Macao,China15746.4孟加拉国Bangladesh14.41081.4文莱BruneiDarussalam0.663.3柬埔寨Cambodia18.172.3印度India328.7341.7印度尼西亚Indonesia190.5113.3伊朗Iran174.539.3以...

SurfaceAreaandPopulationDensitySource:WorldBankWDIDatabase.国家和地区CountryorArea201020002005世界World13426.947.250.1中国China960.0135.4139.8中国香港HongKong,China0.16396.46538.6中国澳门Macao,China…15423.817192.5孟加拉国Bangladesh14.4995.61080.0文莱BruneiDarussalam0.662.168.9柬埔寨Cambodia18.170.575.7印度India328.7354.5383.4印...

CountryAreaandPopulationDensitySource:WorldBankWDIDatabase.国家或地区CountryorArea201320052010世界World13432.550.053.1中国China960.0138.9142.5中国香港HongKong,China0.16488.86689.7中国澳门Macao,China…16719.618000.9孟加拉国Bangladesh14.91099.61161.0文莱BruneiDarussalam0.669.876.0柬埔寨Cambodia18.175.781.4印度India328.7379.1405.5...

POPULATION单位:万人(10000persons)年份总人口YearTotalPopulation19522751.201427.301323.9019573062.411579.691482.7219653504.541793.371711.1719754408.152261.642146.5119784574.912348.222226.6919794632.782376.572256.2119804684.452401.742282.7119814740.352430.912309.4419824800.922464.272336.6519834865.732501.192364.5419844917.752532.3...

HOUSEHOLDPOPULATION单位:万人(10000persons)年份户籍人口男女YearHouseholdPopulationMaleFemale19522751.21427.31323.919573062.41579.71482.719653504.51793.41711.219754408.22261.62146.519784574.92348.22226.719794632.82376.62256.219804684.52401.72282.719814740.32430.92309.419824800.92464.32336.619834835.32485.62349.819844876.12510.923...

POPULATION单位:万人(10000persons)年份总人口YearTotalPopulation19522745.01414.61330.419573062.41579.71482.719653504.51793.41711.219754408.22261.62146.519784574.92348.22226.719794632.82376.62256.219804684.52401.72282.719814740.32430.92309.419824800.92464.32336.619834835.32485.62349.819844876.12510.92365.219854931.02540.02391.0198...

Sheet1Page1GROSSDOMESTICPRODUCT(1978-2006)单位:亿元地区生产年份总值第一第二第三Gross产业产业工业建筑业产业YearDomesticPrimarySecondaryTertiaryProductIndustryIndustryIndustryConstructionIndustry1978108.85.677.470.27.225.81979120.15.285.277.47.829.71980139.16.195.886.98.937.21981-1985951.062.5589.3515.473.9299.21986-19901978.7162...

CountryAreaandPopulationDensitySource:WorldBankWDIDatabase.国家或地区CountryorArea20152005世界World13432.550.2中国China960.0138.9中国香港HongKong,China0.16488.8中国澳门Macao,China…16719.6孟加拉国Bangladesh14.91098.0文莱BruneiDarussalam0.668.7柬埔寨Cambodia18.175.5印度India328.7384.9印度尼西亚Indonesia191.1124.9伊朗Iran174.543.1...

TotalPopulationandNaturalChangesbyRegion地区Region出生率死亡率自然增长率BirthRateDeathRateNaturalGrowthRate(‰)(‰)(‰)全国NationalTotal12.096.815.28北京Beijing6.264.971.29天津Tianjin7.676.071.60河北Hebei12.826.596.23山西Shanxi11.485.735.75内蒙古InnerMongolia9.875.913.96辽宁Liaoning6.405.301.10吉林Jilin7.675.002.67黑龙江Heilongj...

TotalPopulationandNaturalChangesbyRegion地区Region出生率死亡率自然增长率BirthRateDeathRateNaturalGrowthRate(‰)(‰)(‰)全国NationalTotal12.106.935.17北京Beijing8.324.923.40天津Tianjin7.915.862.05河北Hebei13.336.786.55山西Shanxi11.305.975.33内蒙古InnerMongolia10.215.734.48辽宁Liaoning6.895.361.53吉林Jilin7.555.052.50黑龙江Heilong...
![[城市房价]北京市房价趋势分析报告(2025年4月版)-西城区](https://yunshufang001.oss-cn-shenzhen.aliyuncs.com/convert/202505/23/798767/thumb-P1-0950daa9-da49-415b-8cb6-8e3e8d0406f1-320x453.webp) [城市房价]北京市房价趋势分析报告(2025年4月版)-西城区11927页
[城市房价]北京市房价趋势分析报告(2025年4月版)-西城区11927页![[小区点评]胜古南里(北京朝阳)小区居住环境竞争力评级及房价趋势分析报告(2024版)](https://yunshufang001.oss-cn-shenzhen.aliyuncs.com/convert/202508/21/743778/thumb-P1-65381ca8-000b-4af7-98ba-9bb502def2f7-320x453.webp) [小区点评]胜古南里(北京朝阳)小区居住环境竞争力评级及房价趋势分析报告(2024版)8658页
[小区点评]胜古南里(北京朝阳)小区居住环境竞争力评级及房价趋势分析报告(2024版)8658页 河南统计年鉴2016_ 2602114页
![[专精特新]上海新平精细化学品有限公司行业竞争力评级分析报告(2023版)](https://yunshufang001.oss-cn-shenzhen.aliyuncs.com/convert/202509/13/633989/thumb-P1-8b2cf305-38af-4176-aac4-8478d028156f-320x453.webp) [专精特新]上海新平精细化学品有限公司行业竞争力评级分析报告(2023版)8112页
[专精特新]上海新平精细化学品有限公司行业竞争力评级分析报告(2023版)8112页 《特色田园乡村建设指南》836页
![[小区点评]麓湖路3号大院(越秀区)住宅小区居住环境竞争力评级及房价趋势分析报告(2024版)](https://yunshufang001.oss-cn-shenzhen.aliyuncs.com/convert/202505/27/670991/thumb-P1-1e538d71-11a4-48be-b182-b951c310816b-320x453.webp) [小区点评]麓湖路3号大院(越秀区)住宅小区居住环境竞争力评级及房价趋势分析报告(2024版)857页
[小区点评]麓湖路3号大院(越秀区)住宅小区居住环境竞争力评级及房价趋势分析报告(2024版)857页![[小区点评]百合山庄(龙岗区)小区居住环境竞争力评级及房价趋势分析报告(2024版)](https://yunshufang001.oss-cn-shenzhen.aliyuncs.com/convert/202505/28/679483/thumb-P1-64e2c313-39e4-42a4-b577-1efb00d82e09-320x453.webp) [小区点评]百合山庄(龙岗区)小区居住环境竞争力评级及房价趋势分析报告(2024版)859页
[小区点评]百合山庄(龙岗区)小区居住环境竞争力评级及房价趋势分析报告(2024版)859页![[小区点评]东方明珠城(龙岗区)小区居住环境竞争力评级及房价趋势分析报告(2024版)](https://yunshufang001.oss-cn-shenzhen.aliyuncs.com/convert/202505/28/681400/thumb-P1-7f09a123-caf6-42ee-8e91-cce7a101d4c7-320x453.webp) [小区点评]东方明珠城(龙岗区)小区居住环境竞争力评级及房价趋势分析报告(2024版)859页
[小区点评]东方明珠城(龙岗区)小区居住环境竞争力评级及房价趋势分析报告(2024版)859页![[小区点评]安亭中央公园(公寓住宅)(上海嘉定)小区居住环境竞争力评级及房价趋势分析报告(2024版)](https://yunshufang001.oss-cn-shenzhen.aliyuncs.com/convert/202505/29/718371/thumb-P1-58d22179-470a-425d-8267-9244fb675378-320x453.webp) [小区点评]安亭中央公园(公寓住宅)(上海嘉定)小区居住环境竞争力评级及房价趋势分析报告(2024版)1330335页
[小区点评]安亭中央公园(公寓住宅)(上海嘉定)小区居住环境竞争力评级及房价趋势分析报告(2024版)1330335页![[小区点评]彩电宿舍(北京海淀)小区居住环境竞争力评级及房价趋势分析报告(2024版)](https://yunshufang001.oss-cn-shenzhen.aliyuncs.com/convert/202508/21/743782/thumb-P1-fd567665-baa0-475a-a568-3e957c84efda-320x453.webp) [小区点评]彩电宿舍(北京海淀)小区居住环境竞争力评级及房价趋势分析报告(2024版)66257页
[小区点评]彩电宿舍(北京海淀)小区居住环境竞争力评级及房价趋势分析报告(2024版)66257页![[工业企业评级排名]中国专精特新企业行业竞争力评级分析报告(2023版)(样本预览)](https://yunshufang001.oss-cn-shenzhen.aliyuncs.com/convert/202508/26/825083/thumb-P1-2987c4a9-02b8-47a5-b3ec-9f3ee4763fb9-320x453.webp) [工业企业评级排名]中国专精特新企业行业竞争力评级分析报告(2023版)(样本预览)1066111页
[工业企业评级排名]中国专精特新企业行业竞争力评级分析报告(2023版)(样本预览)1066111页![[小区点评]中旅国际公馆(一期)(福田区)小区居住环境竞争力评级及房价趋势分析报告(2024版)](https://yunshufang001.oss-cn-shenzhen.aliyuncs.com/convert/202505/28/678791/thumb-P1-f13d2f31-eec0-4128-99a5-2c06341846b7-320x453.webp) [小区点评]中旅国际公馆(一期)(福田区)小区居住环境竞争力评级及房价趋势分析报告(2024版)1860页
[小区点评]中旅国际公馆(一期)(福田区)小区居住环境竞争力评级及房价趋势分析报告(2024版)1860页![[小区点评]江南水乡(温州市瑞安市)小区居住环境竞争力评级及房价趋势分析报告(2024版)](https://yunshufang001.oss-cn-shenzhen.aliyuncs.com/convert/202502/21/774729/thumb-P1-36fe475d-af8a-44cf-861e-e34aee034fc5-320x453.webp) [小区点评]江南水乡(温州市瑞安市)小区居住环境竞争力评级及房价趋势分析报告(2024版)7163页
[小区点评]江南水乡(温州市瑞安市)小区居住环境竞争力评级及房价趋势分析报告(2024版)7163页![[推荐国标] GB_T 10781.2-2022 白酒质量要求 第2部分:清香型白酒](https://yunshufang001.oss-cn-shenzhen.aliyuncs.com/202305/29/203985/P1-8f6cc700-cd5f-428c-90a8-58084704d8fe.png) [推荐国标] GB_T 10781.2-2022 白酒质量要求 第2部分:清香型白酒8378页
[推荐国标] GB_T 10781.2-2022 白酒质量要求 第2部分:清香型白酒8378页![[小区点评]首开熙悦山澜庭(北京房山)小区居住环境竞争力评级及房价趋势分析报告(2024版)](https://yunshufang001.oss-cn-shenzhen.aliyuncs.com/convert/202508/21/746761/thumb-P1-722d5750-8202-429b-9d38-ee5b554e4236-320x453.webp) [小区点评]首开熙悦山澜庭(北京房山)小区居住环境竞争力评级及房价趋势分析报告(2024版)11958页
[小区点评]首开熙悦山澜庭(北京房山)小区居住环境竞争力评级及房价趋势分析报告(2024版)11958页 走向共同富裕的解决相对贫困思路研究_檀学文30317页
 GB_T 25499-2010 城市污水再生利用 绿地灌溉水质379页
![[推荐国标] GB_T 20977-2007 糕点通则](https://yunshufang001.oss-cn-shenzhen.aliyuncs.com/202305/28/201710/P1-edf88c8a-787d-4203-8765-11bf295da5c5.png) [推荐国标] GB_T 20977-2007 糕点通则79610页
[推荐国标] GB_T 20977-2007 糕点通则79610页![[推荐国标] GB_T 10781.1-2021 白酒质量要求 第1部分:浓香型白酒](https://yunshufang001.oss-cn-shenzhen.aliyuncs.com/202305/29/203842/P1-f9b77e15-9bd6-4547-a529-c7618dc50092.png) [推荐国标] GB_T 10781.1-2021 白酒质量要求 第1部分:浓香型白酒122813页
[推荐国标] GB_T 10781.1-2021 白酒质量要求 第1部分:浓香型白酒122813页 IPO招股书_ 诺诚健华IPO:诺诚健华首次公开发行股票并上市招股说明书51393页