单位:亿元年份资产合计利润总额税金总额施工面积19783038416.5719793326610.1419803461673.3819811.870.303801758.3419821.740.464083802.2219832.800.594296805.3719843.530.657366832.1319853.340.708425951.8...

项目2000200320052007200818461606187820222398271.15557.31889.411596.691921.26增加值82.26103.23205.50440.45632.77竣工产值196.70395.83608.01980.701243.694085.406440.0810268.2917743.8920028.291937.2338...

年份总计总计1952100.0100.0100.0100.0100.031.3121.71957209.81190.28550.0195.5326.117.225.21962279.51780.312929.3228.4694.6-18.2-22.91965434.22946.415953.0336.21230.624.228.01970626.14371.419811.0452...

年份总计总计1952100.0100.0100.0100.0100.031.31957209.81190.28550.0195.5326.117.21962279.51780.312929.3228.4694.6-18.21965434.22946.415953.0336.21230.624.21970626.14371.419811.0452.82034.716.919751132.57182.353688.6750.44219.49.419781635.510089.184353.21091.76031.619.719791830.511129.498310.21233.66664.911.919802068.812173.912067...

年份总计总计1952100.0100.0100.0100.0100.031.3121.71957209.81190.28550.0195.5326.117.225.21962279.51780.312929.3228.4694.6-18.2-22.91965434.22946.415953.0336.21230.624.228.01970626.14371.419811.0452.82034.716.921.419751132.57182.353688.6750.44219.49.48.919781635.510089.184353.21091.76031.619.719.919791830.511129.498310.21233.6666...

年份总计总计1952100.0100.0100.0100.0100.031.3121.71957209.81190.28550.0195.5326.117.225.21962279.51780.312929.3228.4694.6-18.2-22.91965434.22946.415953.0336.21230.624.228.01970626.14371.419811.0452.82034.716.921.419751132.57182.353688.6750.44219.49.48.919781635.510089.184353.21091.76031.619.719.919791830.511129.498310.21233.6666...

IndicesofIndustrialProductionbyCountryandArea资料来源:联合国统计月报数据库。Source:UNMonthlyBulletinofStatisticsDatabase.国家和地区CountryorArea200220032004世界World98.1100.5104.7中国香港HongKong,China94.090.193.1孟加拉国①112.2119.5128.0印度①108.6116.2126.0以色列Israel93.293.099.4日本Japan92.595.4100.5韩国Korea,Rep.108.6114.7...

IndicesofIndustrialProductionbyCountryandArea资料来源:联合国统计月报数据库。Source:UNMonthlyBulletinofStatisticsDatabase.(20国家和地区CountryorArea2003200420052006中国香港HongKong,China101.5孟加拉国①86.492.6100.0110.6印度①85.392.5100.0111.6以色列Israel90.296.3100.0109.7日本Japan94.198.6100.0104.4韩国Korea,Rep.85.294.0100.0108...

IndicesofIndustrialproductionbyCountryandArea资料来源:联合国统计月报数据库。Source:UNMonthlyBulletinofStatisticsDatabase.国家和地区CountryorArea200320062007中国香港HongKong,China101.6100.8孟加拉国①86.4110.6119.6印度①85.3111.6121.0以色列Israel90.2109.7114.6日本Japan94.1104.4107.3韩国Korea,Rep.85.2108.4115.9马来西亚Malaysia86.0...

IndicesofManufacturingProduction资料来源:联合国统计月报数据库。Source:UNMonthlyBulletinofStatisticsDatabase.国家和地区CountryorArea200320062007中国香港HongKong,China102.3100.8中国澳门Macao,China135.999.093.8孟加拉国Bangladesh86.3111.0122.1印度India80.2115.0136.1印度尼西亚Indonesia95.598.3103.5以色列Israel89.9110.1115.1日本Japan...

IndicesofManufacturingProduction资料来源:联合国统计月报数据库。Source:UNMonthlyBulletinofStatisticsDatabase.(200国家和地区CountryorArea2006200720082009中国香港HongKong,China102.3100.894.086.2中国澳门Macao,China99.093.863.529.3孟加拉国Bangladesh108.6119.7131.1140.0文莱BruneiDarussalam100.897.7100.590.6印度India114.9136.1139.5146...

IndicesofManufacturingProduction资料来源:联合国统计月报数据库。Source:UNMonthlyBulletinofStatisticsDatabase.(2010=100)国家或地区CountryorArea20102011201220132014中国香港HongKong,China100.0100.799.9100.099.6中国澳门Macao,China100.0126.6161.0188.3214.6孟加拉国Bangladesh100.0117.0129.5144.6155.8文莱BruneiDarussalam100.0103.4104.21...

TOTALIMPORTSANDEXPORTS单位:万美元(USD10000)年份进口出口YearImportsExports1988148045500889795719891351613886296299199012134226852944901991152188391851130031992174533586961158371993222912100170122743199427488010303517184519953409201424841984351996286287133684152603199732066812858319208419982831891124781707111999268107116729151378...

AREASUNDERCULTIVATION单位:千公顷(1000hectares)年内减少年末实有耕地PerCapitaCultivatedArea(sq.m)面积按乡村人口按农林牧渔业劳动力计算计算CultivatedDereasedinByFarming,Forestry,YearAreasPaddyDryFieldsCultivatedAreasCapitalByRuralAnimalhusbandryand(Year-End)FieldsinThisYearConstructionPopulationFisheryLaborers19492742.581765.111977...

AREASUNDERCULTIVATION单位:千公顷(1000hectares)年内减少年末实有耕地PerCapitaCultivatedArea(sq.m)面积按乡村人口按农林牧渔业劳动力计算计算CultivatedDereasedinByFarming,Forestry,YearAreasPaddyDryFieldsCultivatedAreasCapitalByRuralAnimalhusbandryand(Year-End)FieldsinThisYearConstructionPopulationFisheryLaborers19492742.581765.111977...

Sheet1Page1PASSENGERANDFREIGHTTRAFFIC(CONVERTEDINTOTURNOVERVOLUME)单位:万吨公里(10000ton-km)项目Item20062005Composition(%)2006as%20062005of2005运输总量Total6235489.56266322.099.5100.0100.0铁路Railway3516410.33884165.090.556.462.0公路Highway965185.71042319.492.615.516.6民航AirWay815393.1699992.9116.513.111.2管道Pipelines938500.4...

IndicesofManufacturingProduction资料来源:联合国统计月报数据库。Source:UNMonthlyBulletinofStatisticsDatabase.国家或地区CountryorArea2010201220132014中国香港HongKong,China100.099.9100.199.6中国澳门Macao,China100.0161.0188.3214.6孟加拉国Bangladesh100.0129.5144.6156.5文莱BruneiDarussalam100.0104.2106.198.9印度India100.0104.3103.510...
![[城市房价]北京市房价趋势分析报告(2025年4月版)-西城区](https://yunshufang001.oss-cn-shenzhen.aliyuncs.com/convert/202505/23/798767/thumb-P1-0950daa9-da49-415b-8cb6-8e3e8d0406f1-320x453.webp) [城市房价]北京市房价趋势分析报告(2025年4月版)-西城区11927页
[城市房价]北京市房价趋势分析报告(2025年4月版)-西城区11927页![[小区点评]胜古南里(北京朝阳)小区居住环境竞争力评级及房价趋势分析报告(2024版)](https://yunshufang001.oss-cn-shenzhen.aliyuncs.com/convert/202508/21/743778/thumb-P1-65381ca8-000b-4af7-98ba-9bb502def2f7-320x453.webp) [小区点评]胜古南里(北京朝阳)小区居住环境竞争力评级及房价趋势分析报告(2024版)8658页
[小区点评]胜古南里(北京朝阳)小区居住环境竞争力评级及房价趋势分析报告(2024版)8658页 河南统计年鉴2016_ 2602114页
![[专精特新]上海新平精细化学品有限公司行业竞争力评级分析报告(2023版)](https://yunshufang001.oss-cn-shenzhen.aliyuncs.com/convert/202509/13/633989/thumb-P1-8b2cf305-38af-4176-aac4-8478d028156f-320x453.webp) [专精特新]上海新平精细化学品有限公司行业竞争力评级分析报告(2023版)8112页
[专精特新]上海新平精细化学品有限公司行业竞争力评级分析报告(2023版)8112页 《特色田园乡村建设指南》836页
![[小区点评]麓湖路3号大院(越秀区)住宅小区居住环境竞争力评级及房价趋势分析报告(2024版)](https://yunshufang001.oss-cn-shenzhen.aliyuncs.com/convert/202505/27/670991/thumb-P1-1e538d71-11a4-48be-b182-b951c310816b-320x453.webp) [小区点评]麓湖路3号大院(越秀区)住宅小区居住环境竞争力评级及房价趋势分析报告(2024版)857页
[小区点评]麓湖路3号大院(越秀区)住宅小区居住环境竞争力评级及房价趋势分析报告(2024版)857页![[小区点评]百合山庄(龙岗区)小区居住环境竞争力评级及房价趋势分析报告(2024版)](https://yunshufang001.oss-cn-shenzhen.aliyuncs.com/convert/202505/28/679483/thumb-P1-64e2c313-39e4-42a4-b577-1efb00d82e09-320x453.webp) [小区点评]百合山庄(龙岗区)小区居住环境竞争力评级及房价趋势分析报告(2024版)859页
[小区点评]百合山庄(龙岗区)小区居住环境竞争力评级及房价趋势分析报告(2024版)859页![[小区点评]东方明珠城(龙岗区)小区居住环境竞争力评级及房价趋势分析报告(2024版)](https://yunshufang001.oss-cn-shenzhen.aliyuncs.com/convert/202505/28/681400/thumb-P1-7f09a123-caf6-42ee-8e91-cce7a101d4c7-320x453.webp) [小区点评]东方明珠城(龙岗区)小区居住环境竞争力评级及房价趋势分析报告(2024版)859页
[小区点评]东方明珠城(龙岗区)小区居住环境竞争力评级及房价趋势分析报告(2024版)859页![[小区点评]安亭中央公园(公寓住宅)(上海嘉定)小区居住环境竞争力评级及房价趋势分析报告(2024版)](https://yunshufang001.oss-cn-shenzhen.aliyuncs.com/convert/202505/29/718371/thumb-P1-58d22179-470a-425d-8267-9244fb675378-320x453.webp) [小区点评]安亭中央公园(公寓住宅)(上海嘉定)小区居住环境竞争力评级及房价趋势分析报告(2024版)1330335页
[小区点评]安亭中央公园(公寓住宅)(上海嘉定)小区居住环境竞争力评级及房价趋势分析报告(2024版)1330335页![[小区点评]彩电宿舍(北京海淀)小区居住环境竞争力评级及房价趋势分析报告(2024版)](https://yunshufang001.oss-cn-shenzhen.aliyuncs.com/convert/202508/21/743782/thumb-P1-fd567665-baa0-475a-a568-3e957c84efda-320x453.webp) [小区点评]彩电宿舍(北京海淀)小区居住环境竞争力评级及房价趋势分析报告(2024版)66257页
[小区点评]彩电宿舍(北京海淀)小区居住环境竞争力评级及房价趋势分析报告(2024版)66257页![[工业企业评级排名]中国专精特新企业行业竞争力评级分析报告(2023版)(样本预览)](https://yunshufang001.oss-cn-shenzhen.aliyuncs.com/convert/202508/26/825083/thumb-P1-2987c4a9-02b8-47a5-b3ec-9f3ee4763fb9-320x453.webp) [工业企业评级排名]中国专精特新企业行业竞争力评级分析报告(2023版)(样本预览)1066111页
[工业企业评级排名]中国专精特新企业行业竞争力评级分析报告(2023版)(样本预览)1066111页![[小区点评]中旅国际公馆(一期)(福田区)小区居住环境竞争力评级及房价趋势分析报告(2024版)](https://yunshufang001.oss-cn-shenzhen.aliyuncs.com/convert/202505/28/678791/thumb-P1-f13d2f31-eec0-4128-99a5-2c06341846b7-320x453.webp) [小区点评]中旅国际公馆(一期)(福田区)小区居住环境竞争力评级及房价趋势分析报告(2024版)1860页
[小区点评]中旅国际公馆(一期)(福田区)小区居住环境竞争力评级及房价趋势分析报告(2024版)1860页![[小区点评]江南水乡(温州市瑞安市)小区居住环境竞争力评级及房价趋势分析报告(2024版)](https://yunshufang001.oss-cn-shenzhen.aliyuncs.com/convert/202502/21/774729/thumb-P1-36fe475d-af8a-44cf-861e-e34aee034fc5-320x453.webp) [小区点评]江南水乡(温州市瑞安市)小区居住环境竞争力评级及房价趋势分析报告(2024版)7163页
[小区点评]江南水乡(温州市瑞安市)小区居住环境竞争力评级及房价趋势分析报告(2024版)7163页![[推荐国标] GB_T 20977-2007 糕点通则](https://yunshufang001.oss-cn-shenzhen.aliyuncs.com/202305/28/201710/P1-edf88c8a-787d-4203-8765-11bf295da5c5.png) [推荐国标] GB_T 20977-2007 糕点通则79810页
[推荐国标] GB_T 20977-2007 糕点通则79810页![[推荐国标] GB_T 10781.2-2022 白酒质量要求 第2部分:清香型白酒](https://yunshufang001.oss-cn-shenzhen.aliyuncs.com/202305/29/203985/P1-8f6cc700-cd5f-428c-90a8-58084704d8fe.png) [推荐国标] GB_T 10781.2-2022 白酒质量要求 第2部分:清香型白酒8378页
[推荐国标] GB_T 10781.2-2022 白酒质量要求 第2部分:清香型白酒8378页 10元收款码(仅用于相关项目收款使用)165871页
 GB+1499.2-2024钢筋混凝土用钢 第2部分:热轧带肋钢筋6723页
![[小区点评]首开熙悦山澜庭(北京房山)小区居住环境竞争力评级及房价趋势分析报告(2024版)](https://yunshufang001.oss-cn-shenzhen.aliyuncs.com/convert/202508/21/746761/thumb-P1-722d5750-8202-429b-9d38-ee5b554e4236-320x453.webp) [小区点评]首开熙悦山澜庭(北京房山)小区居住环境竞争力评级及房价趋势分析报告(2024版)11958页
[小区点评]首开熙悦山澜庭(北京房山)小区居住环境竞争力评级及房价趋势分析报告(2024版)11958页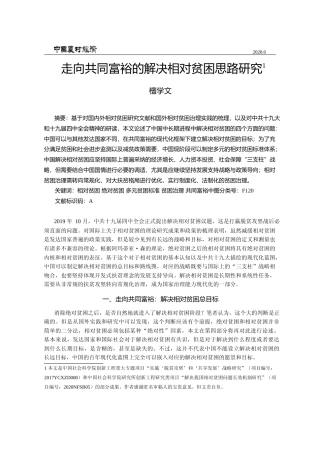 走向共同富裕的解决相对贫困思路研究_檀学文30317页
 GB_T 25499-2010 城市污水再生利用 绿地灌溉水质379页