TownPopulationbyAgeandSex年龄人口数占总人口比重PopulationPercentagetoTotalPopulationAge合计男女合计男TotalMaleFemaleTotalMale227920115864112056100.0050.840-411327629650314.972.760221412349800.970.541224512519940.990.5522358133610211.030.5932268124510220.990.5542242122910130.980.545-913521751860045.933.3052529139511341.110.616261...

CityPopulationbyAgeandSex(pers年龄人口数占总人口比重PopulationPercentagetoTotalPopulationAge合计男女合计男TotalMaleFemaleTotalMale290147144296145851100.0049.730-411143586052823.842.0202307120810990.800.4212159112210370.740.3922292123110610.790.423204110769640.700.3742343122311200.810.425-912830688959414.422.3752422134510770.830....

PopulationbyAgeandSex年龄人口数占总人口比重PopulationPercentagetoTotalPopulationAge合计男女合计男TotalMaleFemaleTotalMale1192666604303588363100.0050.670-46055633121274365.082.78012347672456241.040.56111614641951950.970.54212459680956501.040.57311827645753700.990.54412309671255961.030.565-97058838942316465.923.27513089733357561.1...
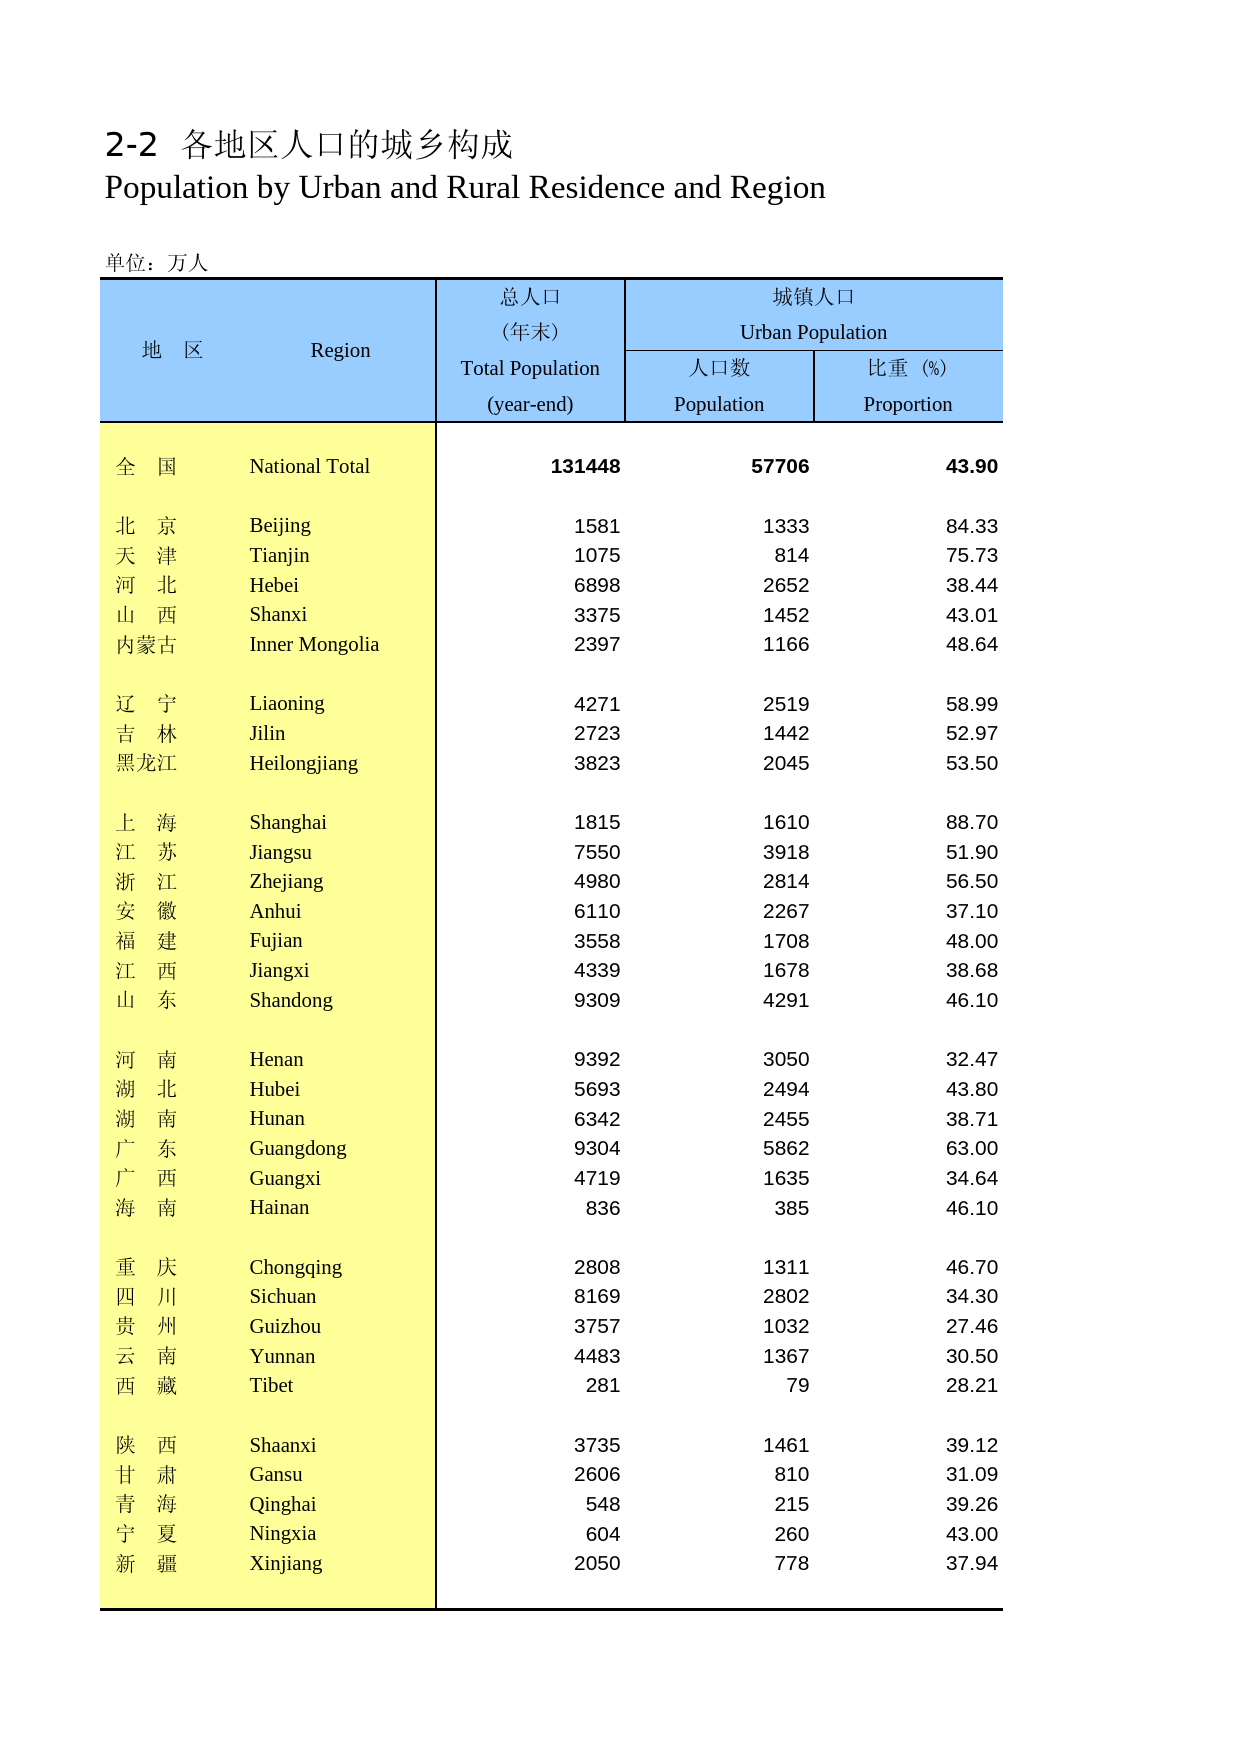
PopulationbyUrbanandRuralResidenceandRegion单位:万人地区Region总人口城镇人口UrbanPopulationTotalPopulation人口数(year-end)PopulationProportion全国NationalTotal1314485770643.90北京Beijing1581133384.33天津Tianjin107581475.73河北Hebei6898265238.44山西Shanxi3375145243.01内蒙古InnerMongolia2397116648.64辽宁Liaoning4271251958.99吉林J...

TotalPopulationandNaturalChangesbyRegion地区Region出生率死亡率自然增长率BirthRateDeathRateNaturalGrowthRate(‰)(‰)(‰)全国NationalTotal12.096.815.28北京Beijing6.264.971.29天津Tianjin7.676.071.60河北Hebei12.826.596.23山西Shanxi11.485.735.75内蒙古InnerMongolia9.875.913.96辽宁Liaoning6.405.301.10吉林Jilin7.675.002.67黑龙江Heilongj...

IndicesofGrossDomesticProduct(PrecedingYear=100)国内生产第一产业第二产业第三产业人均国内生产总值GrossDomesticPrimarySecondaryTertiaryPerCapitaGDPProductIndustryIndustryIndustry(yuan/person)1978111.7104.1115.0113.8110.21979107.6106.1108.2107.9106.11980107.898.5113.6106.0106.51981105.2107.0101.9110.4103.91982109.1111.5105.6113.010...

GrossDomesticProductandComposition单位:亿元国内生产第一产业第二产业总值PrimaryIndustrySecondaryIndustryGross绝对数绝对数DomesticValueProportionValueProportionProduct19783645.21027.528.21745.247.919794062.61270.231.31913.547.119804545.61371.630.22192.048.219814891.61559.531.92255.546.119825323.41777.433.42383.044.819835962.71978...

AverageWageofStaffandWorkersbyRegion地区Region20002001200220032004全国NationalTotal937110870124221404016024北京Beijing1635019155218522531229674天津Tianjin1248014308162581864821754河北Hebei77818730100321118912925山西Shanxi6918812293571072912943内蒙古InnerMongolia6974825096831127913324辽宁Liaoning881110145116591300814921吉林Jilin7...

AverageWageofStaffandWorkersbySector行业合计农、林、牧、渔业采矿业制造业电力、燃气及水的生产和供应业建筑业交通运输、仓储和邮政业信息传输、计算机服务和软件业批发和零售业住宿和餐饮业金融业房地产业租赁和商务服务业科学研究、技术服务和地质勘查业水利、环境和公共设施管理业居民服务和其他服务业教育卫生、社会保障和社会福利业文化、体育和娱...

AverageRealWageIndicesofStaffandWorkersbyStatusofRegistration平均实际工资指数国有城镇集体其他工资指数单位单位单位AverageRealState-UrbanUnitsofAverageRealWageIndicesownedCollective-OtherWageIndices(yearofUnitsownedTypesof(preceding1978=100)UnitsOwnershipyear=100)1978100.0100.0100.0106.01979106.6107.5105.1106.61980113.2113.9112.41...

AverageWageandRelatedIndicesofStaffandWorkersbyStatusofRegistration平均工资指数国有城镇集体其他Average单位单位单位IndexWageState-UrbanUnitsof(preceding(yuan)ownedCollective-Otheryear=100)UnitsownedTypesofUnitsOwnership19524454463481957624637571103.81962551592405108.01965590652398100.7197056160940597.6197156059742999.819725886224...

RegisteredUnemploymentRateinUrbanAreasbyRegion(year-end)地区Region20002001200220032004北京Beijing0.81.21.41.41.3天津Tianjin3.23.63.93.83.8河北Hebei2.83.23.63.94.0山西Shanxi2.22.63.43.03.1内蒙古InnerMongolia3.33.74.14.54.6辽宁Liaoning3.73.26.56.56.5吉林Jilin3.73.13.64.34.2黑龙江Heilongjiang3.34.74.94.24.5上海Shanghai3.54.84.94.5...
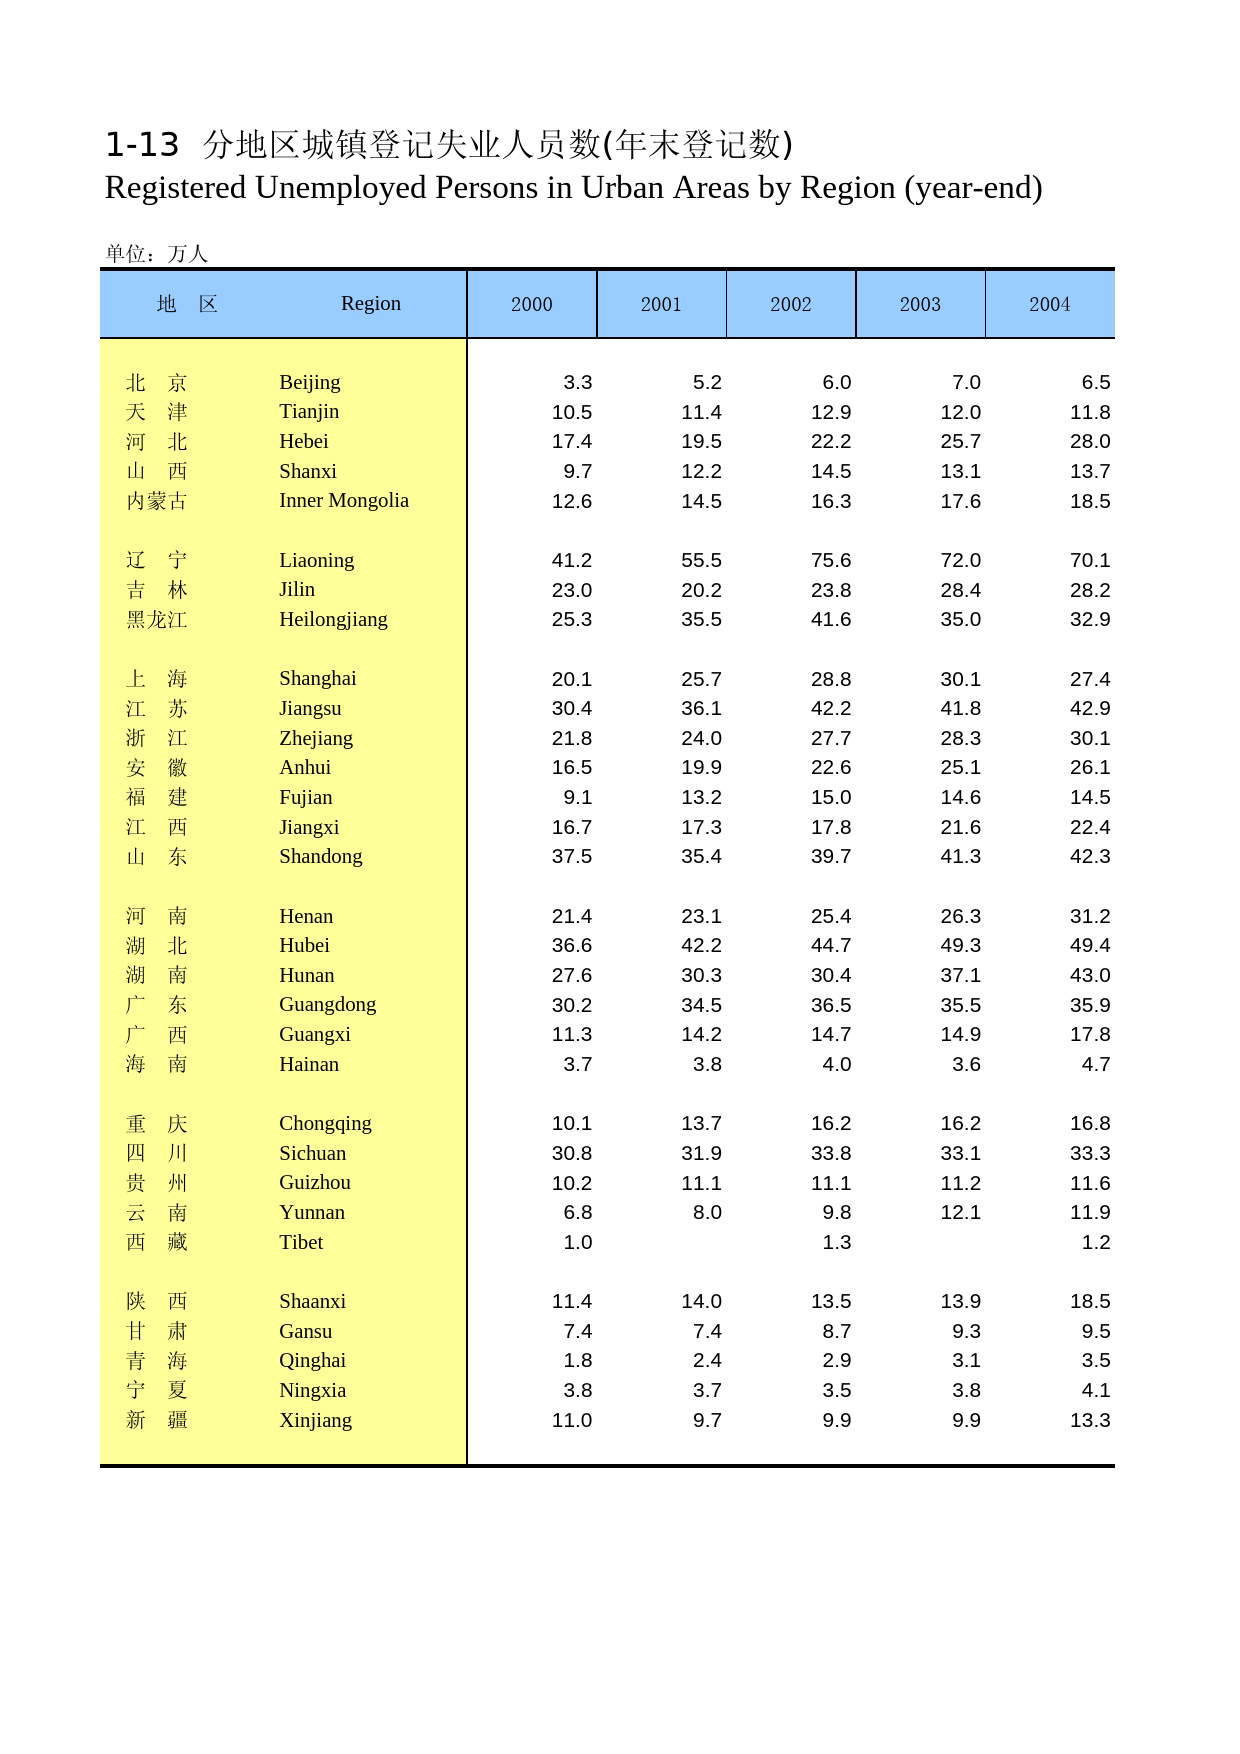
RegisteredUnemployedPersonsinUrbanAreasbyRegion(year-end)单位:万人(地区Region20002001200220032004北京Beijing3.35.26.07.06.5天津Tianjin10.511.412.912.011.8河北Hebei17.419.522.225.728.0山西Shanxi9.712.214.513.113.7内蒙古InnerMongolia12.614.516.317.618.5辽宁Liaoning41.255.575.672.070.1吉林Jilin23.020.223.828.428.2黑龙江Heilongjian...

EmployedPersonsbyUrbanandRuralAreas(year-end)(10就业人员TotalNumberof就业人员就业人员EmployedPersonsEmployedPersonsProportionEmployedPersons195220729248612.018243195321364275412.918610195421832274412.619088195522328280212.519526195623018299313.020025195723771320513.520566195826600530019.921300195926173538920.62078419602588061192...

RegisteredUnemployedPersonsandRegisteredUnemploymentRateinUrbanAreas城镇登记失业人数比上年增长(%)RegisteredUnemployedIncreaseoverPersonsinUrbanAreasPreceedingyear(10000persons)(%)1978530.01979567.67.11980541.5-4.61981439.5-18.81982379.4-13.71983271.4-28.51984235.7-13.21985238.51.21986264.410.91987276.64.61988296.27.11989377.927....

EmployedPersonsbyThreeIndustries(year-end)(10000就业人员第一产业第二产业合计PrimaryIndustrySecondaryIndustryTotalNumber就业人员就业人员ofEmployedEmployedProportionEmployedProportionPersonsPersonsPersons1952207291731783.515317.41953213641774783.117158.01954218321815183.118828.61955223281859283.319138.61956230181854480.6246810.719...

MainIndicatorsofLaborStatistics指标国有单位集体单位其他单位国有单位集体单位其他单位国有单位集体单位其他单位国有单位集体单位其他单位国有单位集体单位其他单位国有单位集体单位其他单位Note:Staffandworkersandtheirtotalwagesareon-poststaffandworkersfigures.Thesameappliestothe1-9全国劳动统计主要指标总人口(万人)16岁以上人口数(万人)经济活...

LifeExpectancyofPopulationbyRegion单位:岁地区RegionLifeExpectancy男女in1990MaleFemale全国NationalTotal68.5566.8470.47北京Beijing72.8671.0774.93天津Tianjin72.3271.0373.73河北Hebei70.3568.4772.53山西Shanxi68.9767.3370.93内蒙古InnerMongolia65.6864.4767.22辽宁Liaoning70.2268.7271.94吉林Jilin67.9566.6569.49黑龙江Heilongjiang66.9765....

PopulationDensity单位:万人(10000persons总人口总人口PopulationPopulationDensityPopulation(person/sq.km)19495416756197997542195055196571980987051951563005919811000721952574826019821016541953587966119831030081954602666319841043571955614656419851058511956628286519861075071957646536719871093001958659946919881110261959672077019891127...

BasicStatisticsonNationalPopulationCensusin1953,1964,1982,1990and2000指标ItemTotalPopulation(10000persons)男Male女FemaleSexRatio(female=100)AverageFamilyHouseholdSize(person/household)PopulationbyAgeGroup(%)0-1415-6465andOver民族人口PopulationbyEthnicityHan(10000persons)PercentagetoTotalPopulation(%)EthnicMinorities(10000persons...
![[城市房价]北京市房价趋势分析报告(2025年4月版)-西城区](https://yunshufang001.oss-cn-shenzhen.aliyuncs.com/convert/202505/23/798767/thumb-P1-0950daa9-da49-415b-8cb6-8e3e8d0406f1-320x453.webp) [城市房价]北京市房价趋势分析报告(2025年4月版)-西城区11927页
[城市房价]北京市房价趋势分析报告(2025年4月版)-西城区11927页![[小区点评]胜古南里(北京朝阳)小区居住环境竞争力评级及房价趋势分析报告(2024版)](https://yunshufang001.oss-cn-shenzhen.aliyuncs.com/convert/202508/21/743778/thumb-P1-65381ca8-000b-4af7-98ba-9bb502def2f7-320x453.webp) [小区点评]胜古南里(北京朝阳)小区居住环境竞争力评级及房价趋势分析报告(2024版)8658页
[小区点评]胜古南里(北京朝阳)小区居住环境竞争力评级及房价趋势分析报告(2024版)8658页 河南统计年鉴2016_ 2602114页
![[专精特新]上海新平精细化学品有限公司行业竞争力评级分析报告(2023版)](https://yunshufang001.oss-cn-shenzhen.aliyuncs.com/convert/202509/13/633989/thumb-P1-8b2cf305-38af-4176-aac4-8478d028156f-320x453.webp) [专精特新]上海新平精细化学品有限公司行业竞争力评级分析报告(2023版)8112页
[专精特新]上海新平精细化学品有限公司行业竞争力评级分析报告(2023版)8112页 《特色田园乡村建设指南》836页
![[小区点评]麓湖路3号大院(越秀区)住宅小区居住环境竞争力评级及房价趋势分析报告(2024版)](https://yunshufang001.oss-cn-shenzhen.aliyuncs.com/convert/202505/27/670991/thumb-P1-1e538d71-11a4-48be-b182-b951c310816b-320x453.webp) [小区点评]麓湖路3号大院(越秀区)住宅小区居住环境竞争力评级及房价趋势分析报告(2024版)857页
[小区点评]麓湖路3号大院(越秀区)住宅小区居住环境竞争力评级及房价趋势分析报告(2024版)857页![[小区点评]百合山庄(龙岗区)小区居住环境竞争力评级及房价趋势分析报告(2024版)](https://yunshufang001.oss-cn-shenzhen.aliyuncs.com/convert/202505/28/679483/thumb-P1-64e2c313-39e4-42a4-b577-1efb00d82e09-320x453.webp) [小区点评]百合山庄(龙岗区)小区居住环境竞争力评级及房价趋势分析报告(2024版)859页
[小区点评]百合山庄(龙岗区)小区居住环境竞争力评级及房价趋势分析报告(2024版)859页![[小区点评]东方明珠城(龙岗区)小区居住环境竞争力评级及房价趋势分析报告(2024版)](https://yunshufang001.oss-cn-shenzhen.aliyuncs.com/convert/202505/28/681400/thumb-P1-7f09a123-caf6-42ee-8e91-cce7a101d4c7-320x453.webp) [小区点评]东方明珠城(龙岗区)小区居住环境竞争力评级及房价趋势分析报告(2024版)859页
[小区点评]东方明珠城(龙岗区)小区居住环境竞争力评级及房价趋势分析报告(2024版)859页![[小区点评]安亭中央公园(公寓住宅)(上海嘉定)小区居住环境竞争力评级及房价趋势分析报告(2024版)](https://yunshufang001.oss-cn-shenzhen.aliyuncs.com/convert/202505/29/718371/thumb-P1-58d22179-470a-425d-8267-9244fb675378-320x453.webp) [小区点评]安亭中央公园(公寓住宅)(上海嘉定)小区居住环境竞争力评级及房价趋势分析报告(2024版)1330335页
[小区点评]安亭中央公园(公寓住宅)(上海嘉定)小区居住环境竞争力评级及房价趋势分析报告(2024版)1330335页![[小区点评]彩电宿舍(北京海淀)小区居住环境竞争力评级及房价趋势分析报告(2024版)](https://yunshufang001.oss-cn-shenzhen.aliyuncs.com/convert/202508/21/743782/thumb-P1-fd567665-baa0-475a-a568-3e957c84efda-320x453.webp) [小区点评]彩电宿舍(北京海淀)小区居住环境竞争力评级及房价趋势分析报告(2024版)66257页
[小区点评]彩电宿舍(北京海淀)小区居住环境竞争力评级及房价趋势分析报告(2024版)66257页![[工业企业评级排名]中国专精特新企业行业竞争力评级分析报告(2023版)(样本预览)](https://yunshufang001.oss-cn-shenzhen.aliyuncs.com/convert/202508/26/825083/thumb-P1-2987c4a9-02b8-47a5-b3ec-9f3ee4763fb9-320x453.webp) [工业企业评级排名]中国专精特新企业行业竞争力评级分析报告(2023版)(样本预览)1066111页
[工业企业评级排名]中国专精特新企业行业竞争力评级分析报告(2023版)(样本预览)1066111页![[小区点评]中旅国际公馆(一期)(福田区)小区居住环境竞争力评级及房价趋势分析报告(2024版)](https://yunshufang001.oss-cn-shenzhen.aliyuncs.com/convert/202505/28/678791/thumb-P1-f13d2f31-eec0-4128-99a5-2c06341846b7-320x453.webp) [小区点评]中旅国际公馆(一期)(福田区)小区居住环境竞争力评级及房价趋势分析报告(2024版)1860页
[小区点评]中旅国际公馆(一期)(福田区)小区居住环境竞争力评级及房价趋势分析报告(2024版)1860页![[小区点评]江南水乡(温州市瑞安市)小区居住环境竞争力评级及房价趋势分析报告(2024版)](https://yunshufang001.oss-cn-shenzhen.aliyuncs.com/convert/202502/21/774729/thumb-P1-36fe475d-af8a-44cf-861e-e34aee034fc5-320x453.webp) [小区点评]江南水乡(温州市瑞安市)小区居住环境竞争力评级及房价趋势分析报告(2024版)7163页
[小区点评]江南水乡(温州市瑞安市)小区居住环境竞争力评级及房价趋势分析报告(2024版)7163页![[小区点评]首开熙悦山澜庭(北京房山)小区居住环境竞争力评级及房价趋势分析报告(2024版)](https://yunshufang001.oss-cn-shenzhen.aliyuncs.com/convert/202508/21/746761/thumb-P1-722d5750-8202-429b-9d38-ee5b554e4236-320x453.webp) [小区点评]首开熙悦山澜庭(北京房山)小区居住环境竞争力评级及房价趋势分析报告(2024版)11958页
[小区点评]首开熙悦山澜庭(北京房山)小区居住环境竞争力评级及房价趋势分析报告(2024版)11958页 走向共同富裕的解决相对贫困思路研究_檀学文30317页
 GB_T 25499-2010 城市污水再生利用 绿地灌溉水质379页
![[推荐国标] GB_T 20977-2007 糕点通则](https://yunshufang001.oss-cn-shenzhen.aliyuncs.com/202305/28/201710/P1-edf88c8a-787d-4203-8765-11bf295da5c5.png) [推荐国标] GB_T 20977-2007 糕点通则79610页
[推荐国标] GB_T 20977-2007 糕点通则79610页![[推荐国标] GB_T 10781.1-2021 白酒质量要求 第1部分:浓香型白酒](https://yunshufang001.oss-cn-shenzhen.aliyuncs.com/202305/29/203842/P1-f9b77e15-9bd6-4547-a529-c7618dc50092.png) [推荐国标] GB_T 10781.1-2021 白酒质量要求 第1部分:浓香型白酒122813页
[推荐国标] GB_T 10781.1-2021 白酒质量要求 第1部分:浓香型白酒122813页![[推荐国标] GB_T 10781.2-2022 白酒质量要求 第2部分:清香型白酒](https://yunshufang001.oss-cn-shenzhen.aliyuncs.com/202305/29/203985/P1-8f6cc700-cd5f-428c-90a8-58084704d8fe.png) [推荐国标] GB_T 10781.2-2022 白酒质量要求 第2部分:清香型白酒8368页
[推荐国标] GB_T 10781.2-2022 白酒质量要求 第2部分:清香型白酒8368页 IPO招股书_ 诺诚健华IPO:诺诚健华首次公开发行股票并上市招股说明书51393页