17-4INSTITUTIONSANDPERSONNELOFBANKINGANDINSURANCESYSTEMS(2014)ItemBankingSystemInsuranceSystemInstitutions(unit)Personnel(person)Institutions(unit)Total4018189776645CoreFunctionalAreaoftheCapital73197330170UrbanFunctionExtensionArea205272933214NewAreaofUrbanDevelopment83914003179EcologicalConservationArea396551082Note:a)Figuresi...

17-2BALANCEOFCREITINDOMESTICANDFOREIGNCURRENCIESFORFINANCIALINSTITUTIONS(INCLUDEFOREIGNBANKS)(10000yuan,atanexchangerateof6.1190)ItemBalanceIncreaseorDecreasethantheBeginningoftheYear201420132014TotalDeposits100095539091660536584350042RMB95370535087990596873799399CorporateDeposits63393050457611624757643740IndividualDeposits26496...

16-14STATISTICSFORKEYSIGHTSPOTSABOVEGRADEAItem20142013NumberofKeySightSpotsAboveGradeA(unit)221215TotalIncome(10000yuan)656909621561TicketIncome417698398495CommoditySales1675013445OtherIncome222462209621TouristsReceived(10000person-times)2868526726InboundTourists897947ADEA2014as%of2013102.8105.7104.8124.6106.1107.394.7

16-12OUTBOUNDCHINESETOURISTSORGANIZEDBYTRAVELAGENCIES(10000person-times)Item201420132014as%of2013NumberofTravelAgencies(unit)367259141.7NumberofOutboundChineseTourists410.2331.0123.9CountriesandRegionsofDestinationHongKong,China26.329.688.8Macao,China13.311.3117.5Taiwan,China27.118.3148.1Thailand47.164.872.8Singapore10.616.664.2...

16-11TOURISTSGROUPED(ORGANIZED)ANDRECEIVEDBYTRAVELAGENCIESItem20142013TouristsGrouped(Organized)(10000person-times)628.0661.3DomesticTourists457.2470.8CompatriotsfromHongKongandMacao,China4.24.9CompatriotsfromTaiwan,China4.34.0Foreigners162.2181.7TouristsReceived(10000person-times)427.0441.6DomesticTourists317.2319.5Compatriotsf...

16-13OPERATIONOFTRAVELSERVICES(10000yuan)Item201420132014as%of2013NumberofEnterprises(unit)12431147108.4BusinessIncome6989125.46103603.4114.5MainBusinessCost6514223.85684509.5114.6BusinessExpenses244497.5193978.6126.0MainBusinessTaxandSurtax28120.724865.8113.1MainBusinessProfits437225.4389009.4112.4ManagementExpenses213697.3186359.8114.7BusinessProfits20062.757391.335.0TotalProfits27881.764177.543.4AverageNumberofEmployedPersons(person)3359131694106.0

16-9TOURSITSRECEIVEDBYSTAR-RATEDHOTELS(BYSTARRATING)(10000person-times)Item20142013TouristsCompositionTouristsCompositionReceived(%)Received(%)TouristsReceived1940.3100.01958.8100.05-Star516.926.6541.627.64-Star623.332.1624.831.93-Star541.727.9563.028.72-Star249.412.9215.211.01-Star9.00.514.10.7InboundTouristsReceived246.5100.02...

16-8TOURSITSRECEIVEDBYSTAR-RATEDHOTELS(BYTYPEOFTOURISTS)Item20142013TouristsCompositionTouristsReceived(%)ReceivedTouristsReceived(10000person-times)1940.3100.01958.8DomesticTourists1693.887.31693.6Foreigners215.511.1233.5CompatriotsfromHongKong,China17.10.918.0CompatriotsfromMacao,China0.80.00.8CompatriotsfromTaiwan,China13.00....

16-10RECEPTIONANDOPERATIONOFTRAVELAGENCIES(1990-2014)YearNumberofNumberofInboundTouristsNumberofBusinessTouristsOutboundEnterprises(Organized)ReceivedChineseTouristsIncome(unit)(10000(10000(10000(10000yuan)person-times)person-times)person-times)199032.554.71991-1995355.6451.7199153.369.1199261.2100.7199371.3103.6199484.191.01.01...

16-7OPERATIONOFSTAR-RATEDHOTELSItemNumberofEnterprisesRentingRateAveragePrices(unit)(%)(yuan/room.day)20142013201420132014Total58161457.658.4513Hotelsof4and5StarGrade19819360.261.66305-Star656263.062.28024-Star13313158.161.0489Hotelsof1to3-StarGrade38342154.054.03303-Star20520754.655.53572-Star16519354.051.62681-Star132127.641.3...

16-6RECEPTIONANDOPERATIONOFSTAR-RATEDHOTELS(1995-2014)YearNumberofTouristsPersons-DayRentingEnterprisesReceivedReceivedRate(unit)(10000person-time)(10000person-day)(%)1995191484.61843.467.01996-20003168.110110.01996207485.31691.663.01997235541.81801.459.01998262605.01867.755.01999263681.51918.657.02000294854.52830.661.02001-2005...

16-5TOURISMSERVICEFACILITIES(1978-2014)YearNumberofHotels5-star4-star3-star2-star1-star(unit)197811197913198020198135198239198341198450198563198680198797198896198910119901221991213199222619932261994175142032723719951971525437935199620415254682361997248162660109371998258163265113321999268173271117312000409213413217646NumberofNumb...

16-4COMPOSITIONOFEXPENDITURESFORTOURISMINBEIJING(2005-2Item2005200620072008ComposititionofExpendituresfor100.0100.0100.0100.0InboundTouristsLong-distanceTransportationExpenses35.330.029.031.1Air30.929.624.425.3Railway1.10.33.03.6Highway3.30.11.62.2LocalTransportationExpenses1.11.72.62.4Accommodation17.332.016.916.4Restaurants9.2...

16-3NUMBEROFTOURISTSTOBEIJING(10000person-times)Item20142013Total26149.725189.0NumberofDomesticTourists25722.224738.8NumberofTouriststoBeijingfromOutsideBeijing15615.814755.5NumberofBeijingCitizensTouringinBeijing10106.49983.3NumberofInboundTourists427.5450.1HongKong,MacaoandTaiwanTourists62.062.5HongKong,China34.235.4Macao,Chin...

16-2NUMBEROFINBOUNDTOURISTSBYCOUNTRY/REGION(1978-2014YearNumberofHongKong,InboundMacaoandForeignerHongJapanTouristsTaiwanTouristsKong197818.73.315.4197925.24.121.1198028.65.821.76.01981-1985295.447.5233.068.3198139.46.831.35.3198245.78.235.98.2198350.98.939.710.0198465.710.052.117.2198593.713.674.027.61986-1990492.0117.7357.0110...

16-1STATISTICSFORINTERNATIONALANDDOMESTICTOURISM(1978-YearNumberofTouriststoBeijingInboundDomestic(10000person-times)TouristsTourists197818.7197925.2198028.61981-1985295.4198139.4198245.7198350.9198465.7198593.71986-1990492.0198699.01987108.11988120.4198964.51990100.01991-1995919.61991132.01992174.81993202.819946913.0203.06710.0...

15-10STATISTICSFORFOREIGNECONOMICCOOPERATION(1984-2014)YearContractNumberofForeignValueForeignTurnoverContractsContracted(USDContracted(USD(unit)Works10000)Works10000)1984922801276850219851228527362083198630744631915351987375547354696198846588534480219891117168523510181990105163756225310561991114932021671189719921301688897762314...
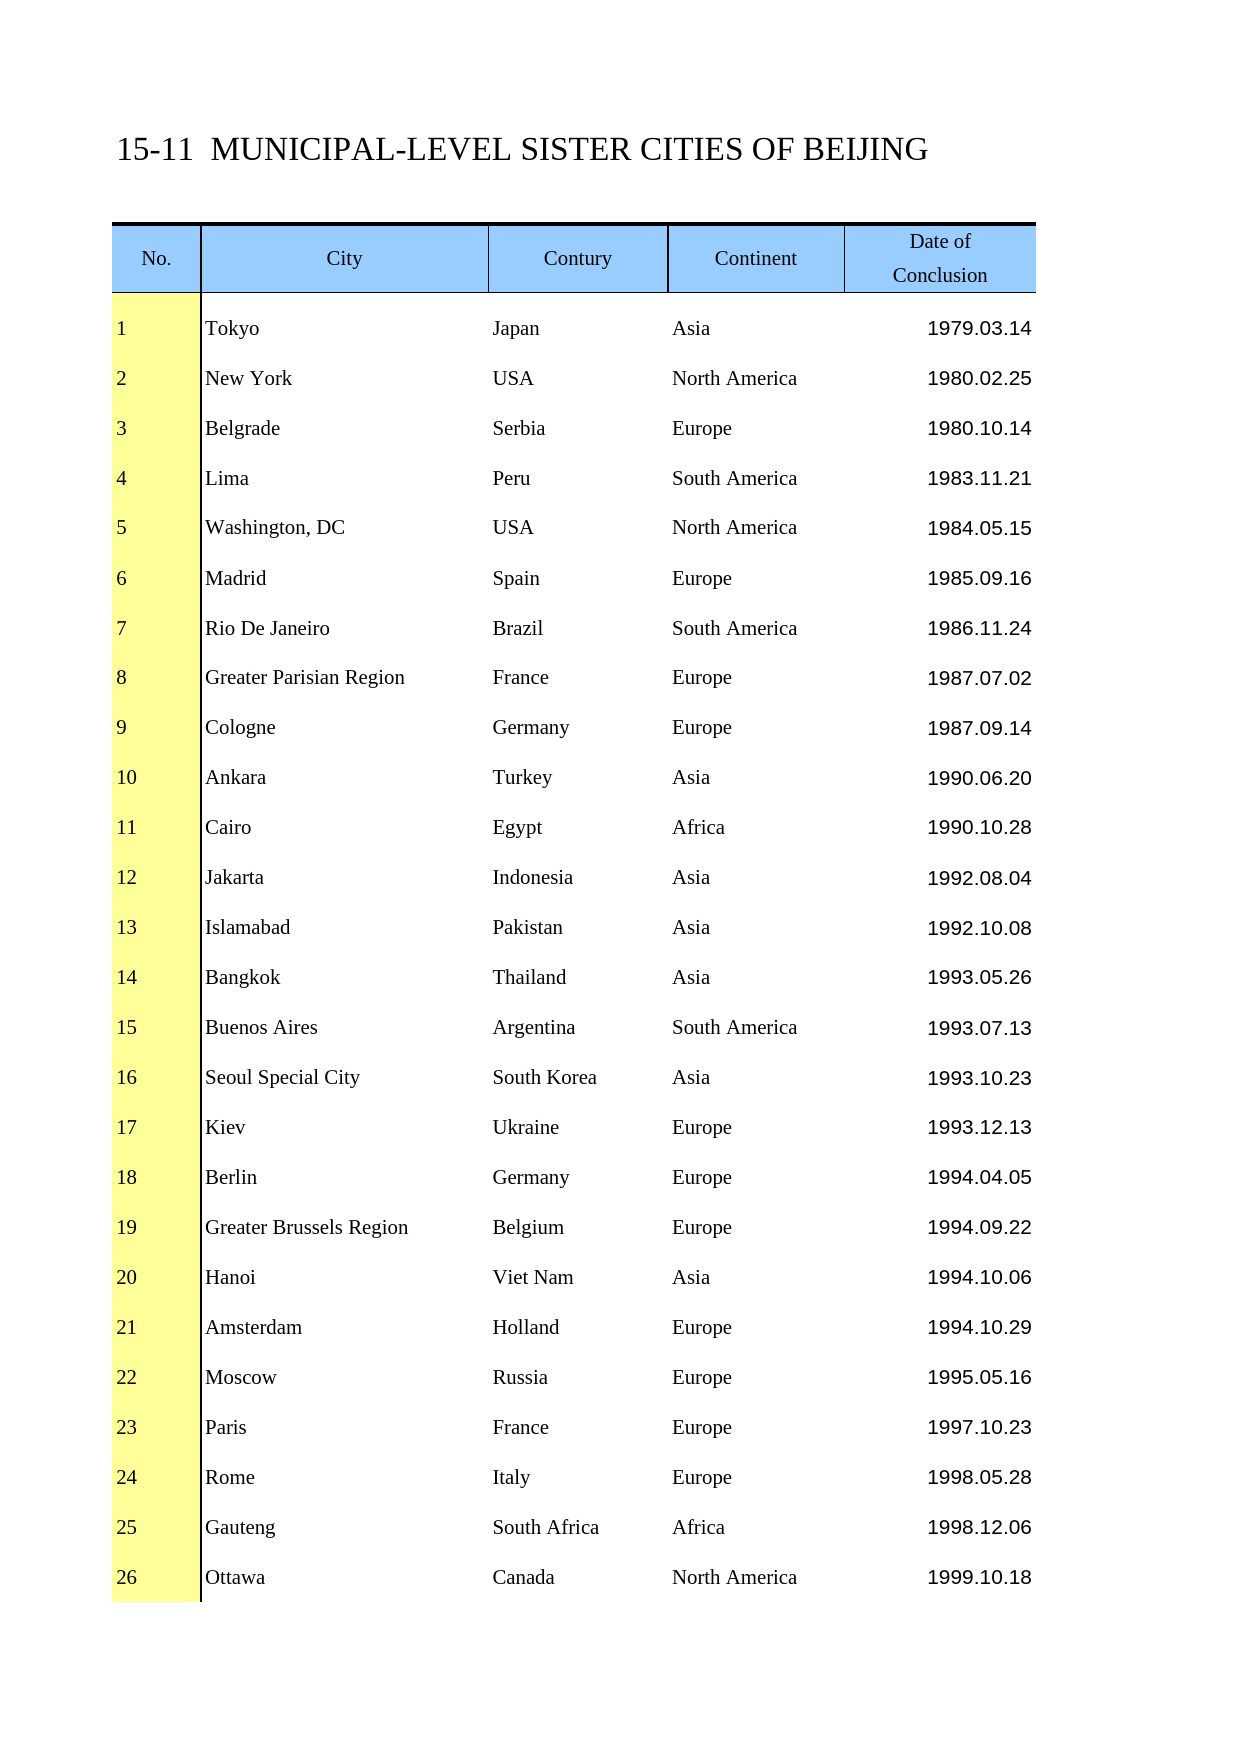
15-11MUNICIPAL-LEVELSISTERCITIESOFBEIJINGNo.CityConturyContinentDateofConclusion1TokyoJapanAsia1979.03.142NewYorkUSANorthAmerica1980.02.253BelgradeSerbiaEurope1980.10.144LimaPeruSouthAmerica1983.11.215Washington,DCUSANorthAmerica1984.05.156MadridSpainEurope1985.09.167RioDeJaneiroBrazilSouthAmerica1986.11.248GreaterParisianRegion...
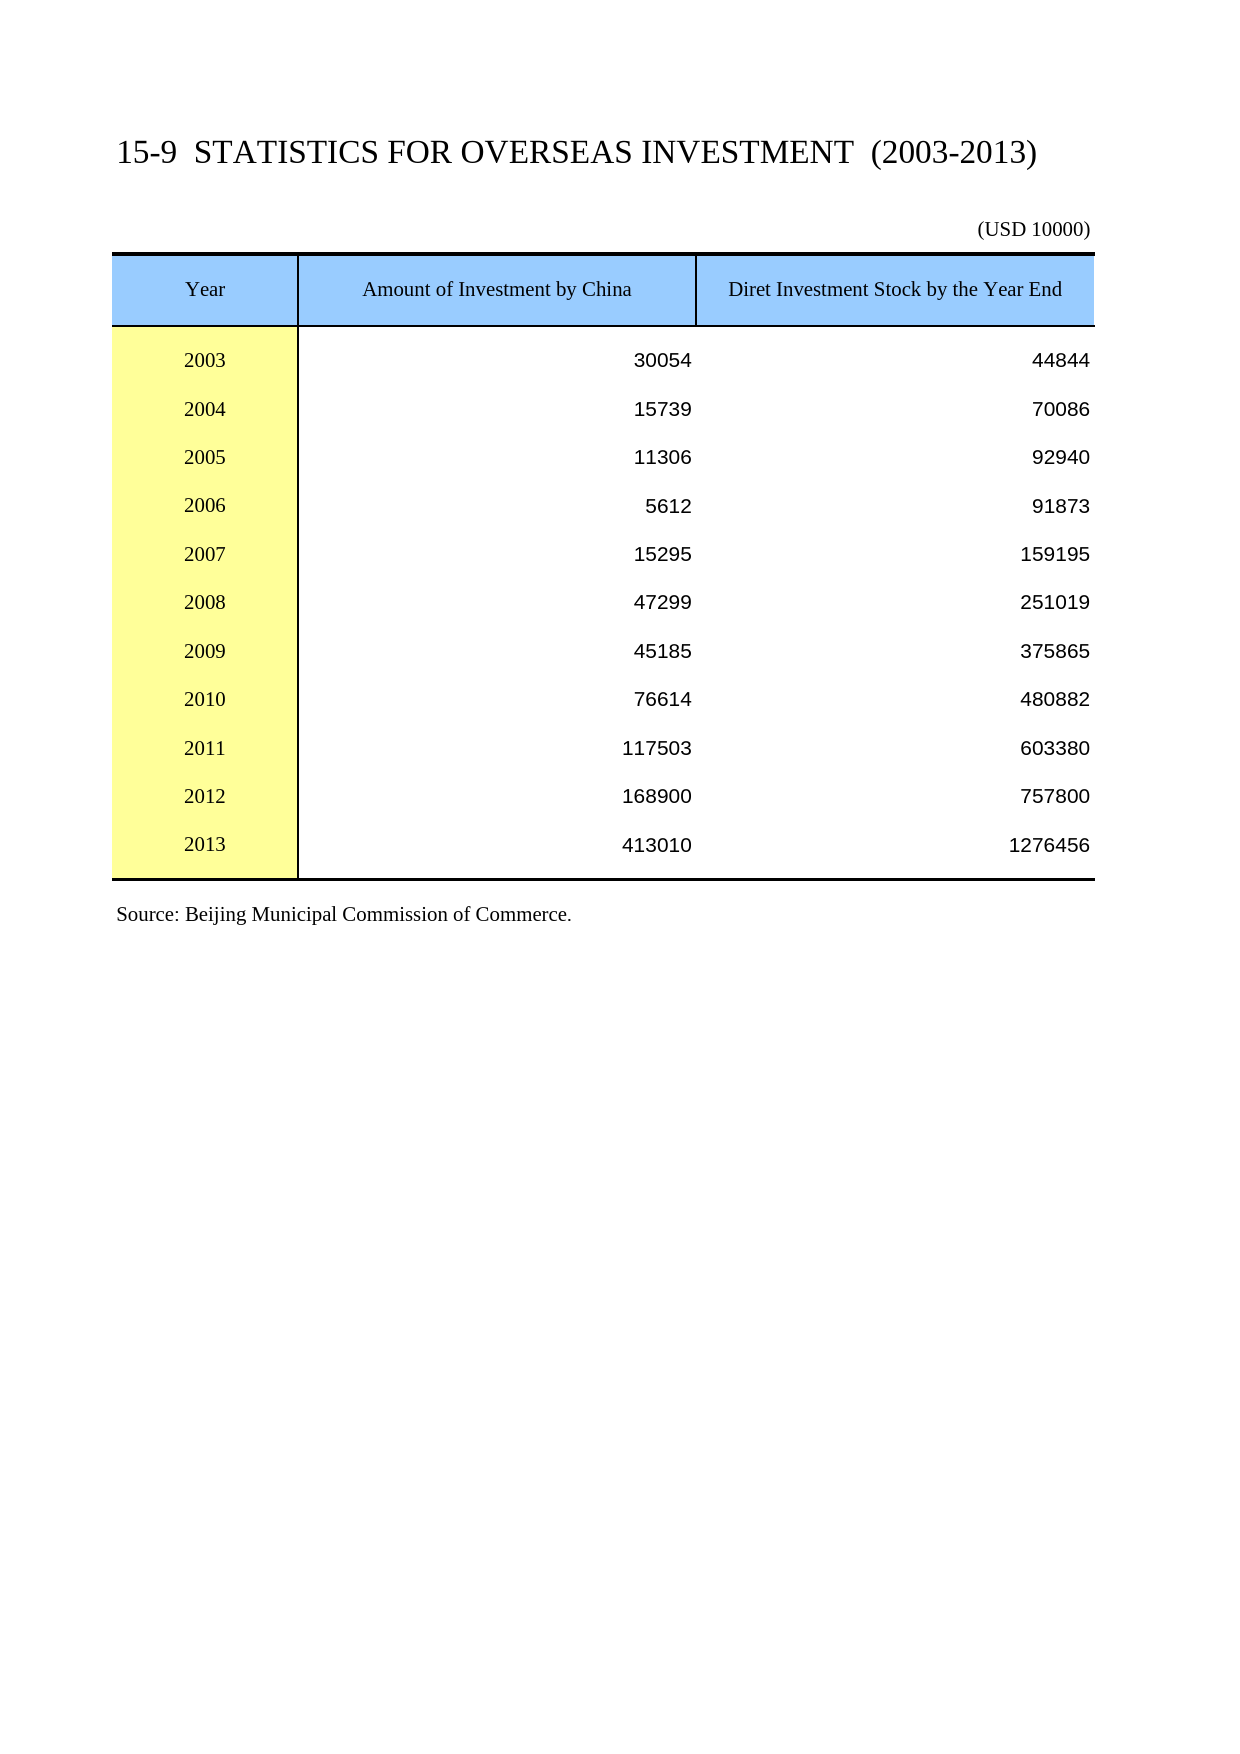
15-9STATISTICSFOROVERSEASINVESTMENT(2003-2013)(USD10000)YearAmountofInvestmentbyChinaDiretInvestmentStockbytheYearEnd20033005444844200415739700862005113069294020065612918732007152951591952008472992510192009451853758652010766144808822011117503603380201216890075780020134130101276456Source:BeijingMunicipalCommissionofCommerce.

15-7ACTUALUSEOFFOREIGNCAPITALBYFOREIGNINVESTEDENTERItem2006200720082009ActualUseofForeignDirectInvestment455191506572608172612094ByRegistrationTypeJointVentures80570778879091691049Cooperatives33039180372137232249Solely-fundedEnterprises341367408754490252448912CompaniesLimitedbyShares2151894563239884ByIndustryPrimaryIndustry54447...
![[城市房价]北京市房价趋势分析报告(2025年4月版)-西城区](https://yunshufang001.oss-cn-shenzhen.aliyuncs.com/convert/202505/23/798767/thumb-P1-0950daa9-da49-415b-8cb6-8e3e8d0406f1-320x453.webp) [城市房价]北京市房价趋势分析报告(2025年4月版)-西城区11927页
[城市房价]北京市房价趋势分析报告(2025年4月版)-西城区11927页![[小区点评]胜古南里(北京朝阳)小区居住环境竞争力评级及房价趋势分析报告(2024版)](https://yunshufang001.oss-cn-shenzhen.aliyuncs.com/convert/202508/21/743778/thumb-P1-65381ca8-000b-4af7-98ba-9bb502def2f7-320x453.webp) [小区点评]胜古南里(北京朝阳)小区居住环境竞争力评级及房价趋势分析报告(2024版)8658页
[小区点评]胜古南里(北京朝阳)小区居住环境竞争力评级及房价趋势分析报告(2024版)8658页 河南统计年鉴2016_ 2602114页
![[专精特新]上海新平精细化学品有限公司行业竞争力评级分析报告(2023版)](https://yunshufang001.oss-cn-shenzhen.aliyuncs.com/convert/202509/13/633989/thumb-P1-8b2cf305-38af-4176-aac4-8478d028156f-320x453.webp) [专精特新]上海新平精细化学品有限公司行业竞争力评级分析报告(2023版)8112页
[专精特新]上海新平精细化学品有限公司行业竞争力评级分析报告(2023版)8112页 《特色田园乡村建设指南》836页
![[小区点评]麓湖路3号大院(越秀区)住宅小区居住环境竞争力评级及房价趋势分析报告(2024版)](https://yunshufang001.oss-cn-shenzhen.aliyuncs.com/convert/202505/27/670991/thumb-P1-1e538d71-11a4-48be-b182-b951c310816b-320x453.webp) [小区点评]麓湖路3号大院(越秀区)住宅小区居住环境竞争力评级及房价趋势分析报告(2024版)857页
[小区点评]麓湖路3号大院(越秀区)住宅小区居住环境竞争力评级及房价趋势分析报告(2024版)857页![[小区点评]百合山庄(龙岗区)小区居住环境竞争力评级及房价趋势分析报告(2024版)](https://yunshufang001.oss-cn-shenzhen.aliyuncs.com/convert/202505/28/679483/thumb-P1-64e2c313-39e4-42a4-b577-1efb00d82e09-320x453.webp) [小区点评]百合山庄(龙岗区)小区居住环境竞争力评级及房价趋势分析报告(2024版)859页
[小区点评]百合山庄(龙岗区)小区居住环境竞争力评级及房价趋势分析报告(2024版)859页![[小区点评]东方明珠城(龙岗区)小区居住环境竞争力评级及房价趋势分析报告(2024版)](https://yunshufang001.oss-cn-shenzhen.aliyuncs.com/convert/202505/28/681400/thumb-P1-7f09a123-caf6-42ee-8e91-cce7a101d4c7-320x453.webp) [小区点评]东方明珠城(龙岗区)小区居住环境竞争力评级及房价趋势分析报告(2024版)859页
[小区点评]东方明珠城(龙岗区)小区居住环境竞争力评级及房价趋势分析报告(2024版)859页![[小区点评]安亭中央公园(公寓住宅)(上海嘉定)小区居住环境竞争力评级及房价趋势分析报告(2024版)](https://yunshufang001.oss-cn-shenzhen.aliyuncs.com/convert/202505/29/718371/thumb-P1-58d22179-470a-425d-8267-9244fb675378-320x453.webp) [小区点评]安亭中央公园(公寓住宅)(上海嘉定)小区居住环境竞争力评级及房价趋势分析报告(2024版)1330335页
[小区点评]安亭中央公园(公寓住宅)(上海嘉定)小区居住环境竞争力评级及房价趋势分析报告(2024版)1330335页![[小区点评]彩电宿舍(北京海淀)小区居住环境竞争力评级及房价趋势分析报告(2024版)](https://yunshufang001.oss-cn-shenzhen.aliyuncs.com/convert/202508/21/743782/thumb-P1-fd567665-baa0-475a-a568-3e957c84efda-320x453.webp) [小区点评]彩电宿舍(北京海淀)小区居住环境竞争力评级及房价趋势分析报告(2024版)66257页
[小区点评]彩电宿舍(北京海淀)小区居住环境竞争力评级及房价趋势分析报告(2024版)66257页![[小区点评]中旅国际公馆(一期)(福田区)小区居住环境竞争力评级及房价趋势分析报告(2024版)](https://yunshufang001.oss-cn-shenzhen.aliyuncs.com/convert/202505/28/678791/thumb-P1-f13d2f31-eec0-4128-99a5-2c06341846b7-320x453.webp) [小区点评]中旅国际公馆(一期)(福田区)小区居住环境竞争力评级及房价趋势分析报告(2024版)1860页
[小区点评]中旅国际公馆(一期)(福田区)小区居住环境竞争力评级及房价趋势分析报告(2024版)1860页![[小区点评]江南水乡(温州市瑞安市)小区居住环境竞争力评级及房价趋势分析报告(2024版)](https://yunshufang001.oss-cn-shenzhen.aliyuncs.com/convert/202502/21/774729/thumb-P1-36fe475d-af8a-44cf-861e-e34aee034fc5-320x453.webp) [小区点评]江南水乡(温州市瑞安市)小区居住环境竞争力评级及房价趋势分析报告(2024版)7163页
[小区点评]江南水乡(温州市瑞安市)小区居住环境竞争力评级及房价趋势分析报告(2024版)7163页![[小区点评]首开熙悦山澜庭(北京房山)小区居住环境竞争力评级及房价趋势分析报告(2024版)](https://yunshufang001.oss-cn-shenzhen.aliyuncs.com/convert/202508/21/746761/thumb-P1-722d5750-8202-429b-9d38-ee5b554e4236-320x453.webp) [小区点评]首开熙悦山澜庭(北京房山)小区居住环境竞争力评级及房价趋势分析报告(2024版)11958页
[小区点评]首开熙悦山澜庭(北京房山)小区居住环境竞争力评级及房价趋势分析报告(2024版)11958页 走向共同富裕的解决相对贫困思路研究_檀学文30317页
 GB_T 25499-2010 城市污水再生利用 绿地灌溉水质379页
 IPO招股书_ 诺诚健华IPO:诺诚健华首次公开发行股票并上市招股说明书51393页
 云南经济普查年鉴2013_ C-D2-B-08-1501页
![[推荐国标] GB_T 15555.12-1995 固体废物 腐蚀性测定 玻璃电极法](https://yunshufang001.oss-cn-shenzhen.aliyuncs.com/202305/28/201617/P1-aea9b913-a8a3-458c-ad83-08bb04d8b1a2.png) [推荐国标] GB_T 15555.12-1995 固体废物 腐蚀性测定 玻璃电极法174页
[推荐国标] GB_T 15555.12-1995 固体废物 腐蚀性测定 玻璃电极法174页![[专精特新]保山恒丰纺织科技有限公司行业竞争力评级分析报告(2023版)](https://yunshufang001.oss-cn-shenzhen.aliyuncs.com/convert/202506/14/652179/thumb-P1-dbc376c9-8756-467a-939d-798b0894c83d-320x453.webp) [专精特新]保山恒丰纺织科技有限公司行业竞争力评级分析报告(2023版)9126页[小区点评]胜古南里(北京朝阳)小区居住环境竞争力评级及房价趋势分析报告(2024版)8658页
[专精特新]保山恒丰纺织科技有限公司行业竞争力评级分析报告(2023版)9126页[小区点评]胜古南里(北京朝阳)小区居住环境竞争力评级及房价趋势分析报告(2024版)8658页