GrossDomesticProductoftheThreeIndustriesbyCounty(County-levelCityandDistrict)(precedingyear=100)County第一产业第二产业第三产业(Cou...

GrossDomesticProductoftheThreeStrataofIndustrybyCounty(County-levelCityandDistrict)(100millionyuan)County第一产业第二产业第三产业(...

NumberofEmployedPersonsattheYear-endbyStrataofIndustrybyCity(10000persons)20212022市别City合计第一产业第二产业第三产业合计第一产业...

NumberofEmployedPersonsatYear-endbyThreestrataofIndustry就业人数年份CompositioninPercentage(%)TotalEmployed第一产业第二产业第三产...

ContributionoftheThreeStrataofIndustrytoGDPGrowth单位:百分点(percentagepoints)地区生产总值年份Gross第一产业第二产业第三产业YearDo...

ContributionRateofThreeIndustries(%)地区生产总值年份Gross第一产业第二产业第三产业YearDomesticPrimarySecondaryTertiaryIndustryProdu...

项目Item固定资产投资额合计Total第一产业PrimaryIndustry第二产业SecondaryIndustry工业Industry建筑业Construction第三产业TertiaryIndustry批发和零售业WholesaleandRetailTrade交通运输、仓储和邮政业Transpo...

19787264143173210036224100.005.9444.1949.8719809956549533972254890100.004.9739.9055.13198543619713672143702278823100.003.1332.9463.93199090593714268346872544797100.001.5738.2960.1419956182515424331...
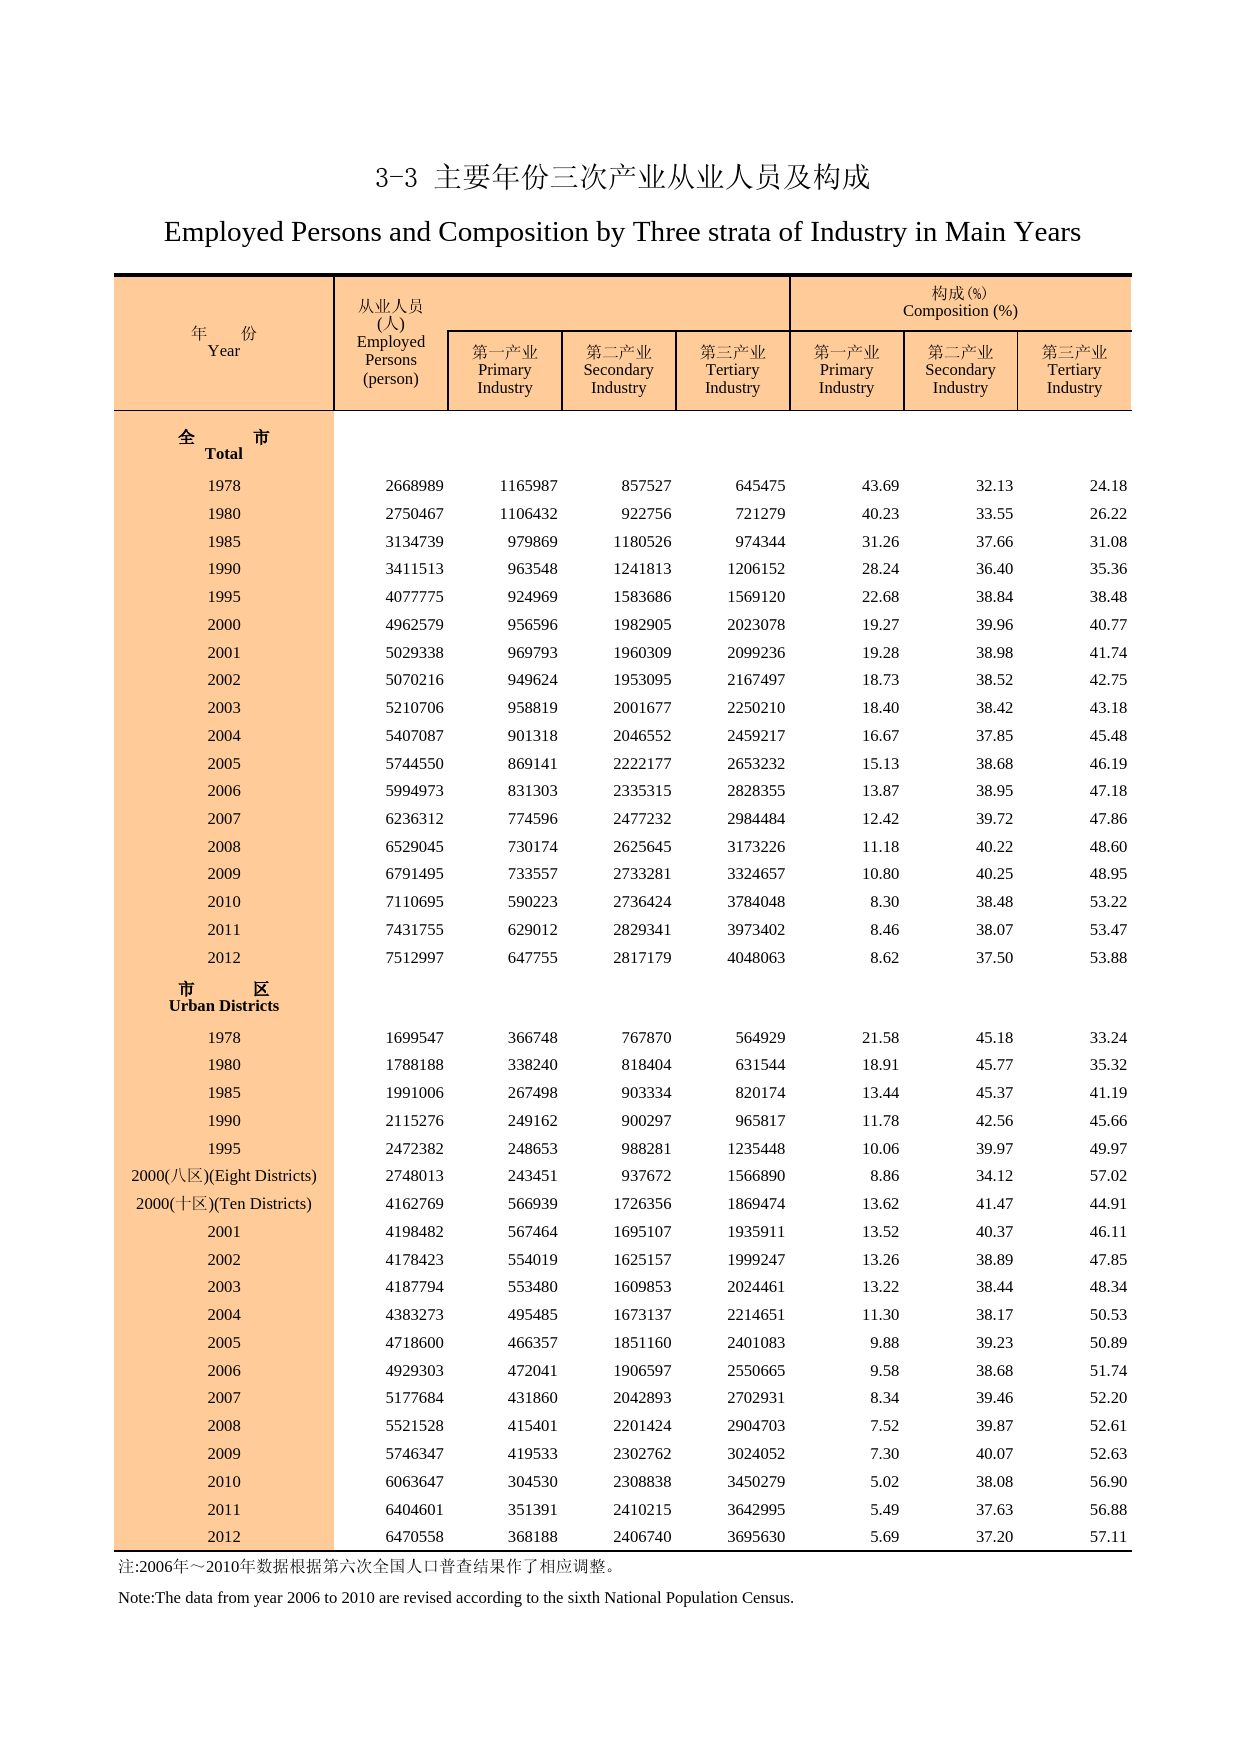
EmployedPersonsandCompositionbyThreestrataofIndustryinMainYears19782668989116598785752764547543.6932.1324.1819802750467110643292275672127940.2333.5526.2219853134739979869118052697434431.2637.6631.0...

EmployedPersonsandCompositionbyThreeStrataofIndustry(Year-endof2012)项目Item合计Total75129976470558100.00100.00第一产业PrimaryIndustry6477553681888.625.69第二产业SecondaryIndustry2817179240674037.5...

ContributionoftheThreeStrataofIndustrytotheGrowthofGDP(1990-2012)(percentagepoints)199011.30.24.24.66.9199116.30.711.610.64.0199223.31.413.111.78.8199326.40.116.313.710.0199418.80.711.89.36.3199516...
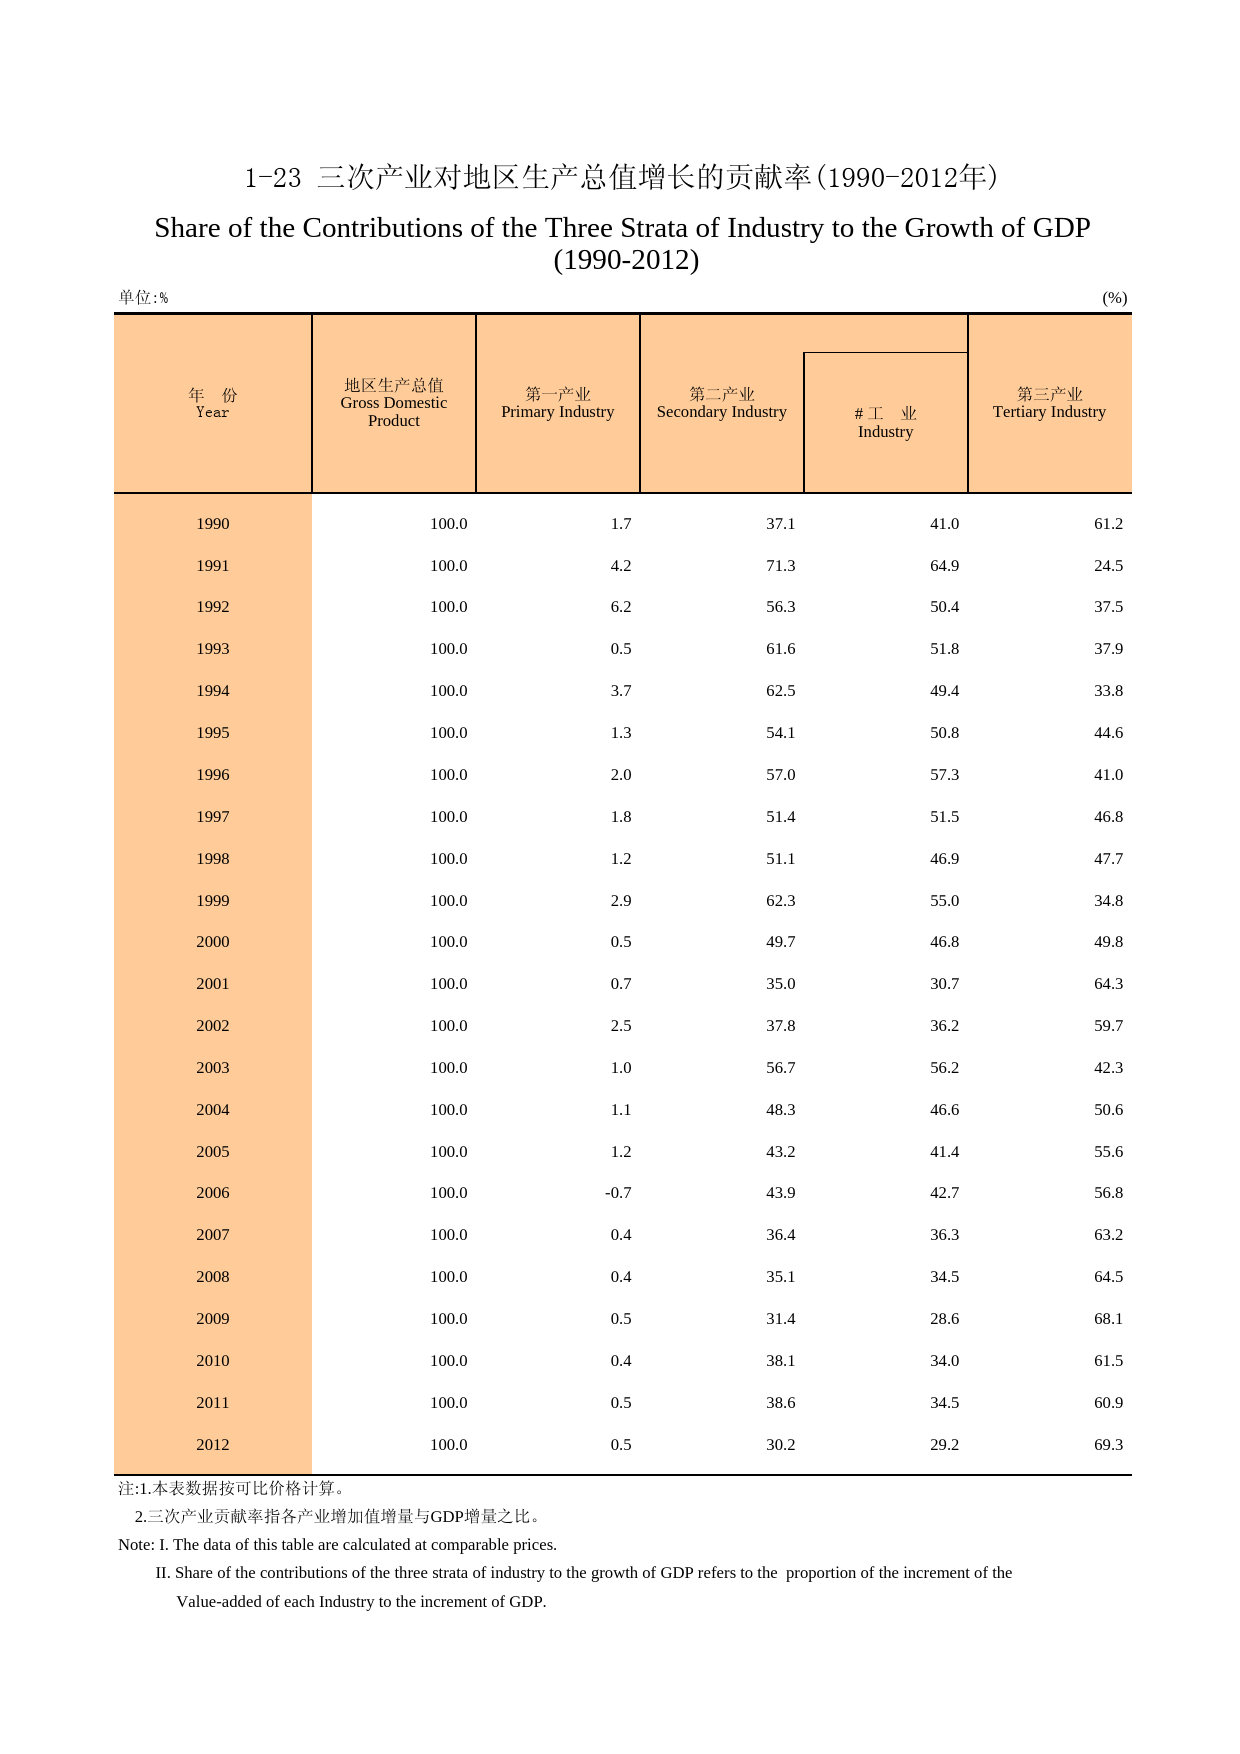
(%)1990100.01.737.141.061.21991100.04.271.364.924.51992100.06.256.350.437.51993100.00.561.651.837.91994100.03.762.549.433.81995100.01.354.150.844.61996100.02.057.057.341.01997100.01.851.451.546.819...

单位:%第一产业第二产业第三产业505022.522.327.527.762.110.323.545.343.817.31737.337.52.219.32423.473565.14.931.230.563.163.910.910.32827.46162.318.432.249.548.41833.537.437.41615.646.5470.20.334.2...
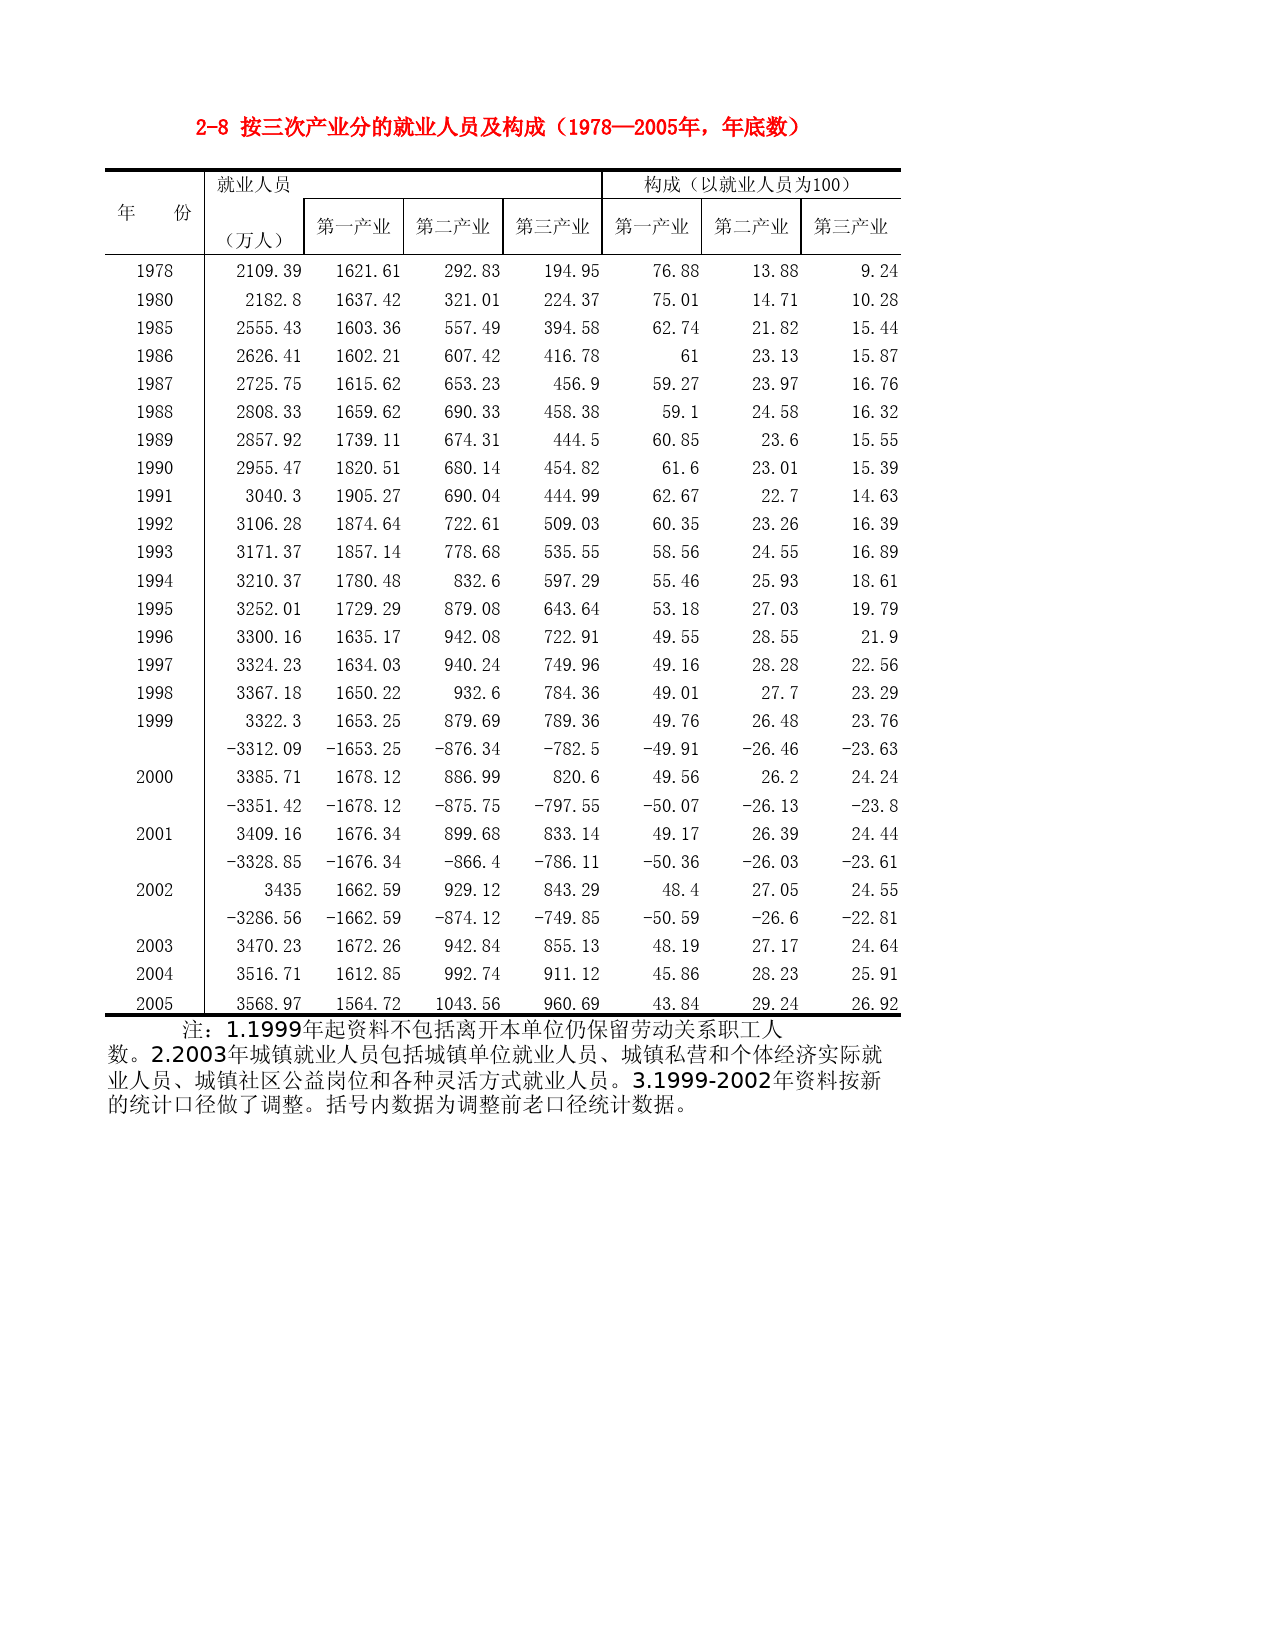
就业人员第一产业第二产业第三产业第一产业第二产业第三产业(万人)19782109.391621.61292.83194.9576.8813.889.2419802182.81637.42321.01224.3775.0114.7110.2819852555.431603.36557.49394.5862.7421.8215.44...

5049.122.521.627.529.362.110.323.545.346.413.513.241.240.42.21.82422.67374.85.14.631.228.863.165.635.31747.810.68.828.127.661.263.518.414.332.23249.553.748.641.814.115.637.242.648.41833.537.41646.5...
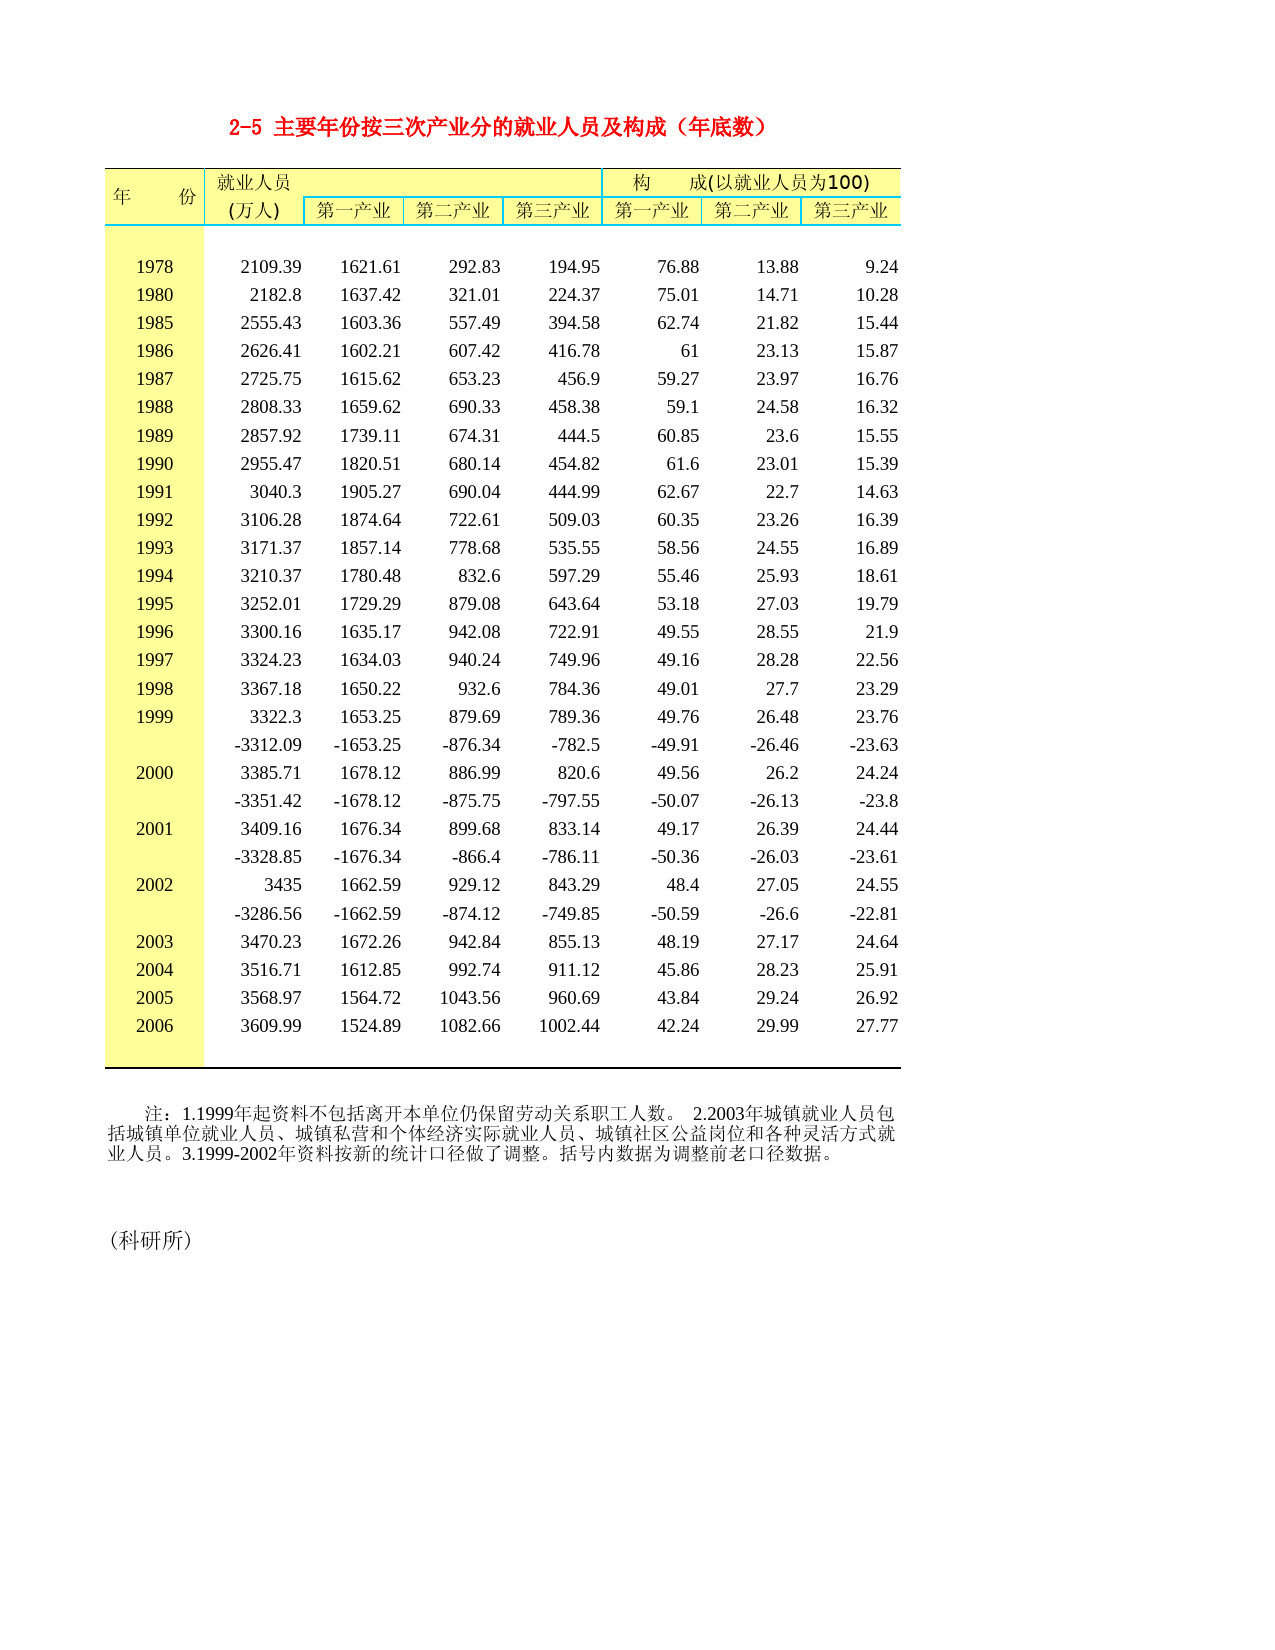
就业人员第一产业第二产业第三产业第一产业第二产业第三产业19782109.391621.61292.83194.9576.8813.889.2419802182.81637.42321.01224.3775.0114.7110.2819852555.431603.36557.49394.5862.7421.8215.4419862626...
2e67c593-3208-4356-aaa7-e398c6c84dffPage1°¼ä.0000_ÂÏÈÏ0.0CÿïuÏÿáÿÿÿÑËÅÏÏÊÏÏÿáÿïÑËÇÏ{ÏÌÏÏÿáÿÑËÄÏzÏÉÏÏÿáÿÿïÑËÔÏyÏÙÏÏÿáÿÿÿæô”...

年份年末从业人员第一产业第二产业第三产业第一产业1978444.1125.9177.9140.328.31979470.5121.4195.2153.925.81980484.2118.0207.3158.924.41981511.7117.2220.4174.122.91982535.2115.1228.6191.521.51983552.0...

年份地区生产第一第二总值产业产业工业建筑业2001100.00.826.723.33.42002100.00.523.418.05.42003100.0-0.233.428.05.42004100.0-0.137.935.42.52005100.0-0.326.924.12.82006100.00.123.517.95.62007100.00.224...

单位:百分点年份地区生产总值第一产业第二产业第三产业200111.70.13.12.78.5200211.50.12.72.18.7200311.1…3.73.17.4200414.1…5.35.08.8200512.1…3.22.98.9200613.0…3.12.39.9200714.5…3.63.110.920089.1…...
![[城市房价]北京市房价趋势分析报告(2025年4月版)-西城区](https://yunshufang001.oss-cn-shenzhen.aliyuncs.com/convert/202505/23/798767/thumb-P1-0950daa9-da49-415b-8cb6-8e3e8d0406f1-320x453.webp) [城市房价]北京市房价趋势分析报告(2025年4月版)-西城区11927页
[城市房价]北京市房价趋势分析报告(2025年4月版)-西城区11927页![[小区点评]胜古南里(北京朝阳)小区居住环境竞争力评级及房价趋势分析报告(2024版)](https://yunshufang001.oss-cn-shenzhen.aliyuncs.com/convert/202508/21/743778/thumb-P1-65381ca8-000b-4af7-98ba-9bb502def2f7-320x453.webp) [小区点评]胜古南里(北京朝阳)小区居住环境竞争力评级及房价趋势分析报告(2024版)8658页
[小区点评]胜古南里(北京朝阳)小区居住环境竞争力评级及房价趋势分析报告(2024版)8658页 河南统计年鉴2016_ 2602114页
![[专精特新]上海新平精细化学品有限公司行业竞争力评级分析报告(2023版)](https://yunshufang001.oss-cn-shenzhen.aliyuncs.com/convert/202509/13/633989/thumb-P1-8b2cf305-38af-4176-aac4-8478d028156f-320x453.webp) [专精特新]上海新平精细化学品有限公司行业竞争力评级分析报告(2023版)8112页
[专精特新]上海新平精细化学品有限公司行业竞争力评级分析报告(2023版)8112页 《特色田园乡村建设指南》836页
![[小区点评]麓湖路3号大院(越秀区)住宅小区居住环境竞争力评级及房价趋势分析报告(2024版)](https://yunshufang001.oss-cn-shenzhen.aliyuncs.com/convert/202505/27/670991/thumb-P1-1e538d71-11a4-48be-b182-b951c310816b-320x453.webp) [小区点评]麓湖路3号大院(越秀区)住宅小区居住环境竞争力评级及房价趋势分析报告(2024版)857页
[小区点评]麓湖路3号大院(越秀区)住宅小区居住环境竞争力评级及房价趋势分析报告(2024版)857页![[小区点评]百合山庄(龙岗区)小区居住环境竞争力评级及房价趋势分析报告(2024版)](https://yunshufang001.oss-cn-shenzhen.aliyuncs.com/convert/202505/28/679483/thumb-P1-64e2c313-39e4-42a4-b577-1efb00d82e09-320x453.webp) [小区点评]百合山庄(龙岗区)小区居住环境竞争力评级及房价趋势分析报告(2024版)859页
[小区点评]百合山庄(龙岗区)小区居住环境竞争力评级及房价趋势分析报告(2024版)859页![[小区点评]东方明珠城(龙岗区)小区居住环境竞争力评级及房价趋势分析报告(2024版)](https://yunshufang001.oss-cn-shenzhen.aliyuncs.com/convert/202505/28/681400/thumb-P1-7f09a123-caf6-42ee-8e91-cce7a101d4c7-320x453.webp) [小区点评]东方明珠城(龙岗区)小区居住环境竞争力评级及房价趋势分析报告(2024版)859页
[小区点评]东方明珠城(龙岗区)小区居住环境竞争力评级及房价趋势分析报告(2024版)859页![[小区点评]安亭中央公园(公寓住宅)(上海嘉定)小区居住环境竞争力评级及房价趋势分析报告(2024版)](https://yunshufang001.oss-cn-shenzhen.aliyuncs.com/convert/202505/29/718371/thumb-P1-58d22179-470a-425d-8267-9244fb675378-320x453.webp) [小区点评]安亭中央公园(公寓住宅)(上海嘉定)小区居住环境竞争力评级及房价趋势分析报告(2024版)1330335页
[小区点评]安亭中央公园(公寓住宅)(上海嘉定)小区居住环境竞争力评级及房价趋势分析报告(2024版)1330335页![[小区点评]彩电宿舍(北京海淀)小区居住环境竞争力评级及房价趋势分析报告(2024版)](https://yunshufang001.oss-cn-shenzhen.aliyuncs.com/convert/202508/21/743782/thumb-P1-fd567665-baa0-475a-a568-3e957c84efda-320x453.webp) [小区点评]彩电宿舍(北京海淀)小区居住环境竞争力评级及房价趋势分析报告(2024版)66257页
[小区点评]彩电宿舍(北京海淀)小区居住环境竞争力评级及房价趋势分析报告(2024版)66257页![[工业企业评级排名]中国专精特新企业行业竞争力评级分析报告(2023版)(样本预览)](https://yunshufang001.oss-cn-shenzhen.aliyuncs.com/convert/202508/26/825083/thumb-P1-2987c4a9-02b8-47a5-b3ec-9f3ee4763fb9-320x453.webp) [工业企业评级排名]中国专精特新企业行业竞争力评级分析报告(2023版)(样本预览)1064111页
[工业企业评级排名]中国专精特新企业行业竞争力评级分析报告(2023版)(样本预览)1064111页![[小区点评]中旅国际公馆(一期)(福田区)小区居住环境竞争力评级及房价趋势分析报告(2024版)](https://yunshufang001.oss-cn-shenzhen.aliyuncs.com/convert/202505/28/678791/thumb-P1-f13d2f31-eec0-4128-99a5-2c06341846b7-320x453.webp) [小区点评]中旅国际公馆(一期)(福田区)小区居住环境竞争力评级及房价趋势分析报告(2024版)1860页
[小区点评]中旅国际公馆(一期)(福田区)小区居住环境竞争力评级及房价趋势分析报告(2024版)1860页![[小区点评]江南水乡(温州市瑞安市)小区居住环境竞争力评级及房价趋势分析报告(2024版)](https://yunshufang001.oss-cn-shenzhen.aliyuncs.com/convert/202502/21/774729/thumb-P1-36fe475d-af8a-44cf-861e-e34aee034fc5-320x453.webp) [小区点评]江南水乡(温州市瑞安市)小区居住环境竞争力评级及房价趋势分析报告(2024版)7163页
[小区点评]江南水乡(温州市瑞安市)小区居住环境竞争力评级及房价趋势分析报告(2024版)7163页![[小区点评]首开熙悦山澜庭(北京房山)小区居住环境竞争力评级及房价趋势分析报告(2024版)](https://yunshufang001.oss-cn-shenzhen.aliyuncs.com/convert/202508/21/746761/thumb-P1-722d5750-8202-429b-9d38-ee5b554e4236-320x453.webp) [小区点评]首开熙悦山澜庭(北京房山)小区居住环境竞争力评级及房价趋势分析报告(2024版)11958页
[小区点评]首开熙悦山澜庭(北京房山)小区居住环境竞争力评级及房价趋势分析报告(2024版)11958页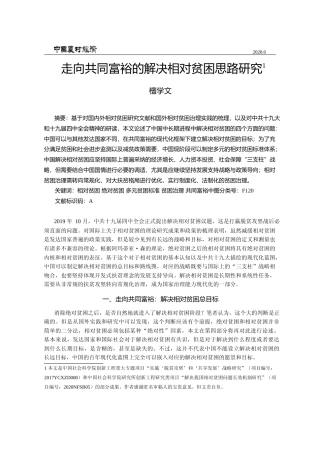 走向共同富裕的解决相对贫困思路研究_檀学文30317页
 GB_T 25499-2010 城市污水再生利用 绿地灌溉水质379页
![[推荐国标] GB_T 20977-2007 糕点通则](https://yunshufang001.oss-cn-shenzhen.aliyuncs.com/202305/28/201710/P1-edf88c8a-787d-4203-8765-11bf295da5c5.png) [推荐国标] GB_T 20977-2007 糕点通则79610页
[推荐国标] GB_T 20977-2007 糕点通则79610页![[推荐国标] GB_T 10781.1-2021 白酒质量要求 第1部分:浓香型白酒](https://yunshufang001.oss-cn-shenzhen.aliyuncs.com/202305/29/203842/P1-f9b77e15-9bd6-4547-a529-c7618dc50092.png) [推荐国标] GB_T 10781.1-2021 白酒质量要求 第1部分:浓香型白酒122813页
[推荐国标] GB_T 10781.1-2021 白酒质量要求 第1部分:浓香型白酒122813页 IPO招股书_ 诺诚健华IPO:诺诚健华首次公开发行股票并上市招股说明书51393页
 云南经济普查年鉴2013_ C-D2-B-08-1501页