EmploymentItem2010EconomicallyActivePopulation(10000persons)78388TotalNumberofEmployedPersons(10000persons)76105第一产业PrimaryIndustry27931第二产业SecondaryIndustry21842第三产业TertiaryIndustry26332CompositionofEmployedPersons(total=100)第一产业PrimaryIndustry36.7第二产业SecondaryIndustry28.7第三产业TertiaryIndustry34.6Numberof...

PopulationDensity总人口人口密度总人口人口密度PopulationPopulationDensityPopulationPopulationDensity(10000persons)(person/sq.km)(10000persons)(person/sq.km)1949541675619831030081071950551965719841043571091951563005919851058511101952574826019535879661198610750711219871093001141954602666319881110261161955614656419891127041171956628...

Item1953TotalPopulation(10000persons)58260男Male30190女Female28070SexRatio(female=100)107.56AverageFamilyHouseholdSize(person/household)4.33PercentageofPopulationbyAgeGroup(%)Aged0-1436.28Aged15-6459.31Aged65andOver4.41民族人口PopulationbyEthnicityHan(10000persons)54728PercentagetoTotalPopulation(%)93.94EthnicMinorities(10000per...

PopulationLifeExpectancybyRegion单位:岁RegionLifeExpectancy男女LifeExpectancyin1990MaleFemalein2000全国NationalTotal68.5566.8470.4771.40北京Beijing72.8671.0774.9376.10天津Tianjin72.3271.0373.7374.91河北Hebei70.3568.4772.5372.54山西Shanxi68.9767.3370.9371.65内蒙古InnerMongolia65.6864.4767.2269.87辽宁Liaoning70.2268.7271.9473.34...

LifeExpectancyatBirth单位:岁198167.7766.2869.27199068.5566.8470.47199670.80200071.4069.6373.33200572.9570.8375.25201074.8372.3877.37201576.3473.6479.431-9平均预期寿命年份Year合计Total男Male女Female

FloatingPopulation单位:亿人人户分离人口YearPopulationofResidentce-RegistrationInconsystency20001.44200520102.6120112.7120122.7920132.8920142.9820152.94Note:Dataof2000and2010arebasedontheNationalPopulationCensusandtherestareestimatesbasedonannualnationalsamplesurveysofpopulation.1-8流动人口数年份注:2000年、2010年分别为当年人口...

BirthRate,DeathRateandNaturalGrowthRateofPopulationbyRegion单位:‰Region19901991出生率死亡率出生率死亡率增长率BirthDeathNaturalBirthDeathRateRateGrowthRateRateRate全国NationalTotal21.066.6714.3919.686.70北京Beijing13.015.817.208.035.82天津Tianjin15.615.789.8311.945.78河北Hebei20.466.8213.6416.596.75山西Shanxi22.546.5615.9821.56...

ProportionofUrbanPopulationatYear-endbyRegionRegion200520062007200820092010全国NationalTotal42.9944.3445.8946.9948.3449.95北京Beijing83.6284.3384.5084.9085.0085.96天津Tianjin75.1175.7376.3177.2378.0179.55河北Hebei37.6938.7740.2541.9043.7444.50山西Shanxi42.1143.0144.0345.1145.9948.05内蒙古InnerMongolia47.2048.6450.1551.7153.4055....

BirthRate,DeathRateandNaturalGrowthRateofPopulation单位:‰(‰)出生率死亡率自然增长率YearBirthRateDeathRateNaturalGrowthRate197818.256.2512.00197917.826.2111.61198018.216.3411.87198120.916.3614.55198222.286.6015.68198320.196.9013.29198419.906.8213.08198521.046.7814.26198622.436.8615.57198723.336.7216.61198822.376.6415.73198921.5...

PopulationbyUrbanandRuralResidence(10000persons,%)TotalUrbanRuralPopulation人口数比重人口数比重(year-end)PopulationProportionPopulationProportion194954167576510.644840289.36195055196616911.184902788.82195156300663211.784966888.22195561465828513.485318086.521960662071307319.755313480.251965725381304517.985949382.02197082992144241...

PopulationbySex(10000persons,%)男女TotalMaleFemalePopulation人口数比重人口数比重(year-end)PopulationProportionPopulationProportion1949541672814551.962602248.041950551962866951.942652748.061951563002923151.922706948.081955614653180951.752965648.251960662073428351.783192448.221965725383712851.183541048.821970829924268651.434030648...

AgeCompositionandDependencyRatioofPopulation总人口各年龄组人口TotalAged0-14Aged15-64Population人口数人口数(year-end)PopulationProportionPopulationProportion1953587962133136.33487259.31964704992868640.73930355.819821016543414633.66251761.519871093003134728.77198565.919901143333165927.77630666.719951211213221826.68139367.219961223...
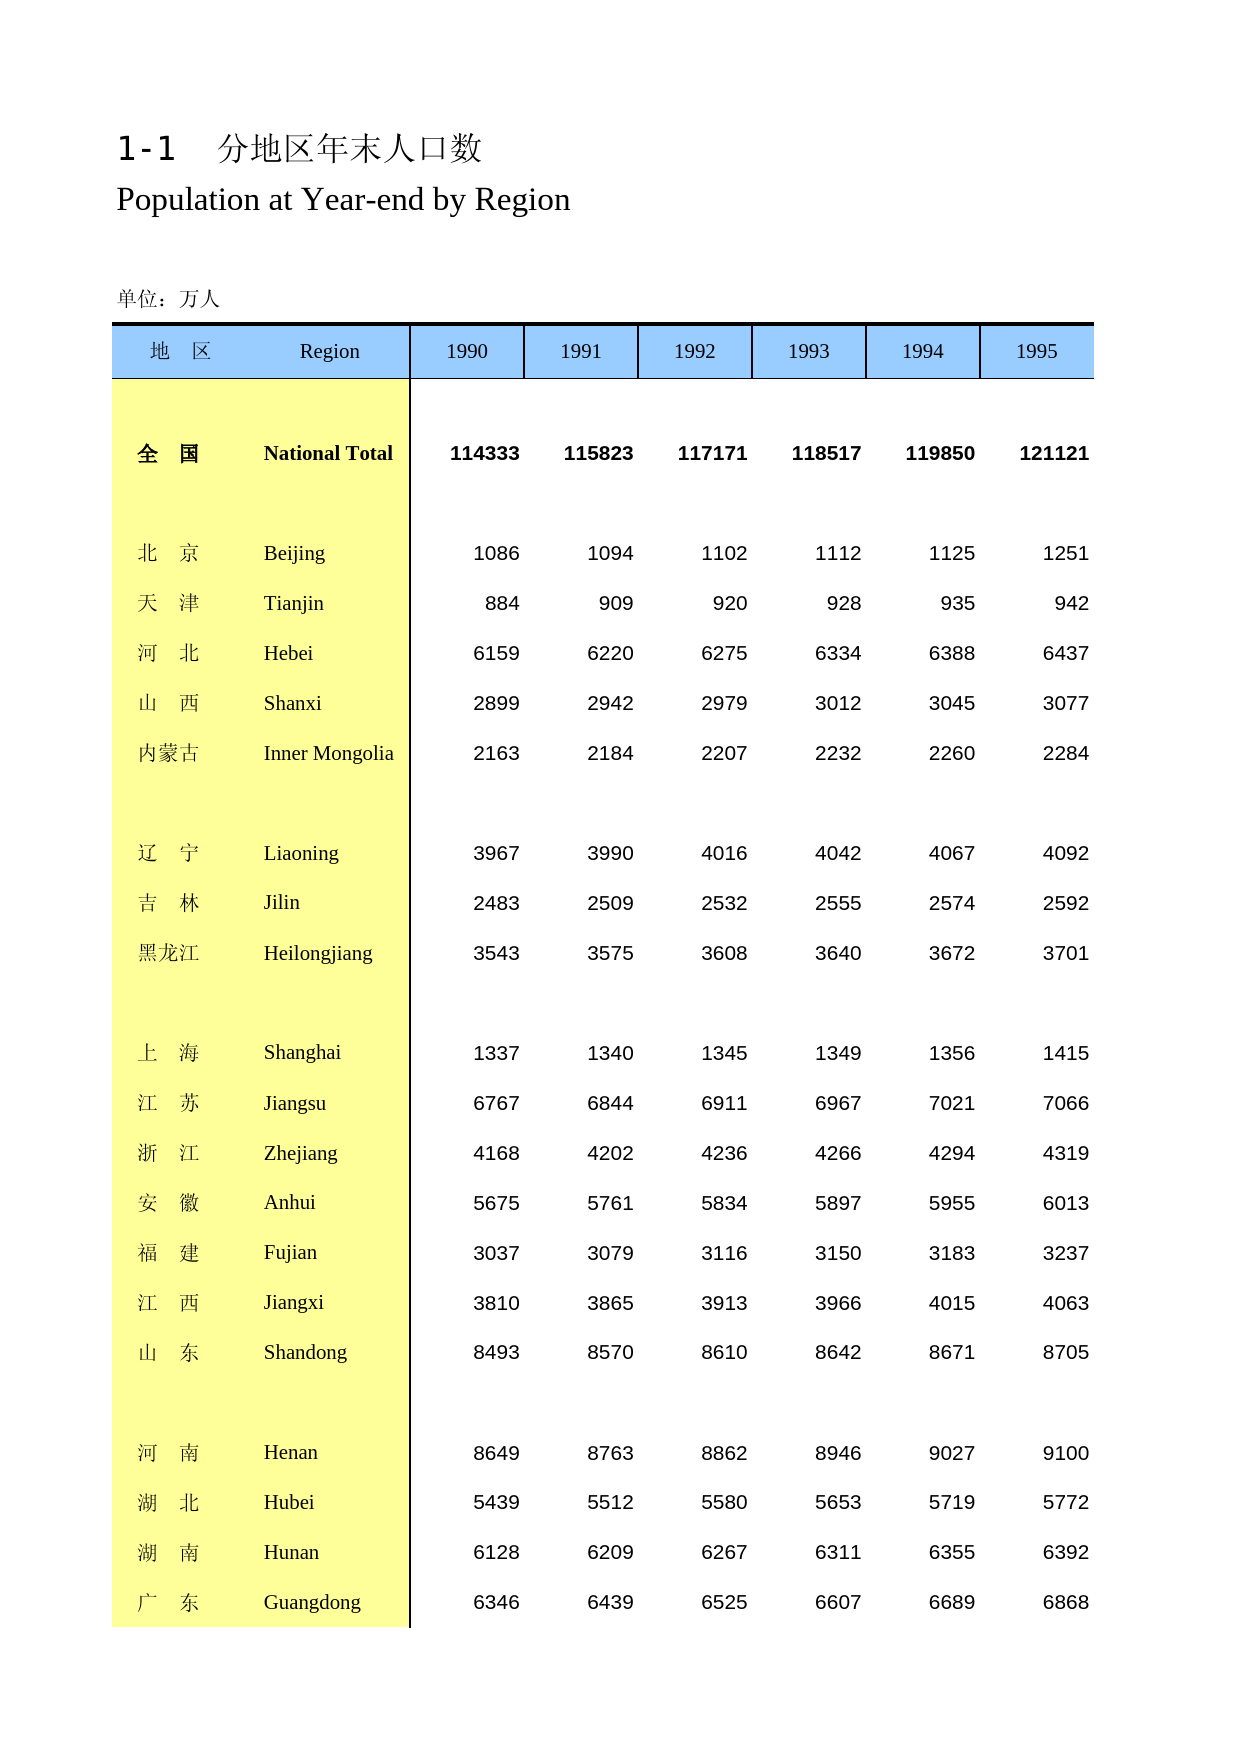
PopulationatYear-endbyRegion单位:万人Region199019911992199319941995全国NationalTotal114333115823117171118517119850121121北京Beijing108610941102111211251251天津Tianjin884909920928935942河北Hebei615962206275633463886437山西Shanxi289929422979301230453077内蒙古InnerMongolia216321842207223222602284辽宁Liaoning39673990401640424067409...

MainIndicatorsofAreaandPopulationItem20102011Area(10000sq.km)3.63.6Year-endPopulation(10000persons)2316.22322.5男Male1163.51164.6女Female1152.71157.9CrudeBirthRate(‰)7.218.48CrudeDeathRate(‰)6.306.59NaturalPopulationGrowthRate(‰)0.911.88FertilityRate(‰)2732MarriageRate(couple/1000persons)6.007.13DivorceRate(couple/1000person...

ConsumerPriceIndices总指数食品服装居住GeneralIndexFoodClothingHousingTransportation&Communications200693.587.492.896.696.0200795.289.995.497.597.7200898.597.696.399.099.9200997.797.295.698.795.9201098.697.897.299.298.62011100.0100.0100.0100.0100.02012101.9104.2102.5101.1100.42013102.7105.5102.3102.1100.92014103.9109.4103.6102.99...

LabourForceandEmploymentItem20082009LabourForce(10000persons)1085.31091.7男Male617.3618.0女Female468.0473.7Employment(10000persons)1040.31027.9男Male590.2577.6女Female450.1450.2DistributionofEmploymentbyIndustry(%)100.0100.0农、林、渔、牧业Agriculture,Forestry,Fisheryand5.15.3AnimalHusbandry工业Industry36.835.8矿业及土石采取业Mi...

MedianMonthlyEmploymentEarningsbyIndustry单位:澳门元Occupation20102011总数Total900010000制造业Manufacturing57006500水电及气体生产供应业Electricity,Gas&WaterSupply1600017500建筑业Construction950010100批发及零售业Wholesale&RetailTrade75008000酒店及饮食业Hotels,Restaurants&SimilarActivities70007500运输、仓储及通信业Transport,Stora...

ConsumerPriceIndexItems20102011综合消费价格指数CompositeConsumerPriceIndex总指数GlobalIndex100.0080.5085.17食品及非酒精饮料FoodandNon-alcoholicBeverages28.9776.1982.39烟酒AlcoholicBeveragesandTobacco0.9270.0070.83服装、鞋ClothingandFootwear6.4687.7593.66住房及燃料HousingandFuels26.7075.0277.60家居设备及用品HouseholdGoodsandFurni...

EmployedPopulationbyIndustry单位:万人Industry20092010总数Total31.1931.48制造业Manufacturing1.641.52水电及气体生产供应业Electricity,Gas&WaterSupply0.090.09建筑业Construction3.182.71批发及零售业Wholesale&RetailTrades4.084.14酒店及饮食业Hotels,Restaurants&SimilarActivities4.324.28运输、仓储及通信业Transport,Storage&Communications1...

LabourForceandUnemploymentItem200820092010LabourForce(10000persons)32.732.332.4男Male17.316.616.5女Female15.415.715.9EmployedPopulation(10000persons)31.731.231.5UnemployedPopulation(10000persons)1.01.10.9UnemploymentRate(%)3.03.52.87-17经济活动人口及失业状况项目劳动人口(万人)就业人口(万人)失业人口(万人)失业率(%)201120122013201433.635.036.839.517.118.118.920.716.516.917.918.732.834.336.138.80.90.70.70.72.62.01.81.7
![[城市房价]北京市房价趋势分析报告(2025年4月版)-西城区](https://yunshufang001.oss-cn-shenzhen.aliyuncs.com/convert/202505/23/798767/thumb-P1-0950daa9-da49-415b-8cb6-8e3e8d0406f1-320x453.webp) [城市房价]北京市房价趋势分析报告(2025年4月版)-西城区11927页
[城市房价]北京市房价趋势分析报告(2025年4月版)-西城区11927页![[小区点评]胜古南里(北京朝阳)小区居住环境竞争力评级及房价趋势分析报告(2024版)](https://yunshufang001.oss-cn-shenzhen.aliyuncs.com/convert/202508/21/743778/thumb-P1-65381ca8-000b-4af7-98ba-9bb502def2f7-320x453.webp) [小区点评]胜古南里(北京朝阳)小区居住环境竞争力评级及房价趋势分析报告(2024版)8658页
[小区点评]胜古南里(北京朝阳)小区居住环境竞争力评级及房价趋势分析报告(2024版)8658页 河南统计年鉴2016_ 2602114页
![[专精特新]上海新平精细化学品有限公司行业竞争力评级分析报告(2023版)](https://yunshufang001.oss-cn-shenzhen.aliyuncs.com/convert/202509/13/633989/thumb-P1-8b2cf305-38af-4176-aac4-8478d028156f-320x453.webp) [专精特新]上海新平精细化学品有限公司行业竞争力评级分析报告(2023版)8112页
[专精特新]上海新平精细化学品有限公司行业竞争力评级分析报告(2023版)8112页 《特色田园乡村建设指南》836页
![[小区点评]麓湖路3号大院(越秀区)住宅小区居住环境竞争力评级及房价趋势分析报告(2024版)](https://yunshufang001.oss-cn-shenzhen.aliyuncs.com/convert/202505/27/670991/thumb-P1-1e538d71-11a4-48be-b182-b951c310816b-320x453.webp) [小区点评]麓湖路3号大院(越秀区)住宅小区居住环境竞争力评级及房价趋势分析报告(2024版)857页
[小区点评]麓湖路3号大院(越秀区)住宅小区居住环境竞争力评级及房价趋势分析报告(2024版)857页![[小区点评]百合山庄(龙岗区)小区居住环境竞争力评级及房价趋势分析报告(2024版)](https://yunshufang001.oss-cn-shenzhen.aliyuncs.com/convert/202505/28/679483/thumb-P1-64e2c313-39e4-42a4-b577-1efb00d82e09-320x453.webp) [小区点评]百合山庄(龙岗区)小区居住环境竞争力评级及房价趋势分析报告(2024版)859页
[小区点评]百合山庄(龙岗区)小区居住环境竞争力评级及房价趋势分析报告(2024版)859页![[小区点评]东方明珠城(龙岗区)小区居住环境竞争力评级及房价趋势分析报告(2024版)](https://yunshufang001.oss-cn-shenzhen.aliyuncs.com/convert/202505/28/681400/thumb-P1-7f09a123-caf6-42ee-8e91-cce7a101d4c7-320x453.webp) [小区点评]东方明珠城(龙岗区)小区居住环境竞争力评级及房价趋势分析报告(2024版)859页
[小区点评]东方明珠城(龙岗区)小区居住环境竞争力评级及房价趋势分析报告(2024版)859页![[小区点评]安亭中央公园(公寓住宅)(上海嘉定)小区居住环境竞争力评级及房价趋势分析报告(2024版)](https://yunshufang001.oss-cn-shenzhen.aliyuncs.com/convert/202505/29/718371/thumb-P1-58d22179-470a-425d-8267-9244fb675378-320x453.webp) [小区点评]安亭中央公园(公寓住宅)(上海嘉定)小区居住环境竞争力评级及房价趋势分析报告(2024版)1330335页
[小区点评]安亭中央公园(公寓住宅)(上海嘉定)小区居住环境竞争力评级及房价趋势分析报告(2024版)1330335页![[小区点评]彩电宿舍(北京海淀)小区居住环境竞争力评级及房价趋势分析报告(2024版)](https://yunshufang001.oss-cn-shenzhen.aliyuncs.com/convert/202508/21/743782/thumb-P1-fd567665-baa0-475a-a568-3e957c84efda-320x453.webp) [小区点评]彩电宿舍(北京海淀)小区居住环境竞争力评级及房价趋势分析报告(2024版)66257页
[小区点评]彩电宿舍(北京海淀)小区居住环境竞争力评级及房价趋势分析报告(2024版)66257页![[工业企业评级排名]中国专精特新企业行业竞争力评级分析报告(2023版)(样本预览)](https://yunshufang001.oss-cn-shenzhen.aliyuncs.com/convert/202508/26/825083/thumb-P1-2987c4a9-02b8-47a5-b3ec-9f3ee4763fb9-320x453.webp) [工业企业评级排名]中国专精特新企业行业竞争力评级分析报告(2023版)(样本预览)1066111页
[工业企业评级排名]中国专精特新企业行业竞争力评级分析报告(2023版)(样本预览)1066111页![[小区点评]中旅国际公馆(一期)(福田区)小区居住环境竞争力评级及房价趋势分析报告(2024版)](https://yunshufang001.oss-cn-shenzhen.aliyuncs.com/convert/202505/28/678791/thumb-P1-f13d2f31-eec0-4128-99a5-2c06341846b7-320x453.webp) [小区点评]中旅国际公馆(一期)(福田区)小区居住环境竞争力评级及房价趋势分析报告(2024版)1860页
[小区点评]中旅国际公馆(一期)(福田区)小区居住环境竞争力评级及房价趋势分析报告(2024版)1860页![[小区点评]江南水乡(温州市瑞安市)小区居住环境竞争力评级及房价趋势分析报告(2024版)](https://yunshufang001.oss-cn-shenzhen.aliyuncs.com/convert/202502/21/774729/thumb-P1-36fe475d-af8a-44cf-861e-e34aee034fc5-320x453.webp) [小区点评]江南水乡(温州市瑞安市)小区居住环境竞争力评级及房价趋势分析报告(2024版)7163页
[小区点评]江南水乡(温州市瑞安市)小区居住环境竞争力评级及房价趋势分析报告(2024版)7163页![[推荐国标] GB_T 20977-2007 糕点通则](https://yunshufang001.oss-cn-shenzhen.aliyuncs.com/202305/28/201710/P1-edf88c8a-787d-4203-8765-11bf295da5c5.png) [推荐国标] GB_T 20977-2007 糕点通则79810页
[推荐国标] GB_T 20977-2007 糕点通则79810页![[推荐国标] GB_T 10781.2-2022 白酒质量要求 第2部分:清香型白酒](https://yunshufang001.oss-cn-shenzhen.aliyuncs.com/202305/29/203985/P1-8f6cc700-cd5f-428c-90a8-58084704d8fe.png) [推荐国标] GB_T 10781.2-2022 白酒质量要求 第2部分:清香型白酒8378页
[推荐国标] GB_T 10781.2-2022 白酒质量要求 第2部分:清香型白酒8378页 10元收款码(仅用于相关项目收款使用)165871页
 GB+1499.2-2024钢筋混凝土用钢 第2部分:热轧带肋钢筋6723页
![[小区点评]首开熙悦山澜庭(北京房山)小区居住环境竞争力评级及房价趋势分析报告(2024版)](https://yunshufang001.oss-cn-shenzhen.aliyuncs.com/convert/202508/21/746761/thumb-P1-722d5750-8202-429b-9d38-ee5b554e4236-320x453.webp) [小区点评]首开熙悦山澜庭(北京房山)小区居住环境竞争力评级及房价趋势分析报告(2024版)11958页
[小区点评]首开熙悦山澜庭(北京房山)小区居住环境竞争力评级及房价趋势分析报告(2024版)11958页 走向共同富裕的解决相对贫困思路研究_檀学文30317页
 GB_T 25499-2010 城市污水再生利用 绿地灌溉水质379页