(10000persons)地区Region地区Region全省Province6160.055775.26丹江口市Danjiangkou45.7040.99武汉市Wuhan916.191244.77宜昌市Yichang389.90389.64江岸区Jiang'an79.7296.53西陵区Xiling39.7653.03江汉区Jianghan51.5864.79伍家岗区Wujiagang20.2933.63硚口区Qiaokou54.1966.67点军区Dianjun10.4310.16汉阳区Hanyang74.4983.73猇亭区Xiaoting5.046.87武昌...
(10000persons)Regions户籍人口常住人口Regions户籍人口常住人口TotalPermnantTotalPermnantPopulationPopulationPopulationPopulation荆门市Jingmen288.91259.69Qichun100.4179.21东宝区Duodao35.2735.69Huangmei102.7178.78Duodao29.5443.05Macheng114.9489.37Jingshan62.0554.48Wuxue81.9767.63Shayang58.6839.57咸宁市Xianning305.26265.83Zhongxiang1...
TotalEmployedPersonsfortheWholeSociety单位:万人(10000person)年份合计城镇乡村第一产业第二产业第三产业YearTotalUrbanRuralPrimaryIndustrySecondaryIndustryTertiaryIndustry19521020.30141.60878.7019651404.20222.701181.6019701618.50278.001340.8019751802.50381.701420.8019781910.40458.001452.301470.60269.00170.8019801986.90507.201479.70...
CompositionofUrbanandRuralPopulation(10000persons)YearTotalPopulation19522745.00271.412416.1719573062.41411.692650.7219653504.54485.063019.4819754408.15626.223781.9319804684.45786.493897.9619854980.811464.653516.1619865047.831187.233860.6019875120.271288.613831.6619885184.941389.993794.9519895258.831491.373767.4619905439.291551....
Population(10000persons)YearTotalPopulation19522745.01414.61330.419573062.41579.71482.719653504.51793.31711.219754408.22261.72146.519804684.52401.82282.719854931.02540.02391.04980.82566.32414.519864989.02573.42415.65047.82603.32444.519875058.12608.72449.45120.32640.32480.019885144.22652.12492.15184.92673.12511.819895223.92694.62...
NaturalChangeofPopulationNumberofPopulationChanged(10000persons)GrowthRates自然增长数YearNumberofBirthNumberofDeathBirthRateDeathRateNaturalGrowthRate1965121.4834.7586.7335.1010.0425.06197590.8034.5256.2820.747.8812.86198094.8432.5962.2520.367.0013.36198597.8337.3760.4619.957.6212.331986107.0939.4567.6421.017.7413.271987108.5636...
ValueAddedofPrivateEconomy(2020)地区RegionsValue-Added(100millionyuan)Percentage(%)2019202020192020全省Total24820.5422944.6554.652.8武汉市Wuhan6963.616294.3142.940.3黄石市Huangshi1017.36935.5457.657.0十堰市Shiyan1048.81933.4252.148.7宜昌市Yichang2825.892623.9963.361.6襄阳市Xiangyang2544.852411.4452.952.4鄂州市Ezhou799.21673.3170...
GrossDomesticProductofCitiesandPrefectures(2020)(100millionyuan)地区RegionsGrossDomesticProductPrimaryIndustrySecondaryIndustryTertiaryIndustry武汉市Wuhan15616.06402.185557.479656.41黄石市Huangshi1641.32115.79797.80727.73十堰市Shiyan1915.07190.25793.18931.64宜昌市Yichang4261.42459.681828.461973.28襄阳市Xiangyang4601.97513.012104...
IndicesofGrossDomesticProductofCitiesandPrefectures(2020)(precedingyear=100,%)地区Regions地区生产总值GrossDomesticProductPrimaryIndustrySecondaryIndustryTertiaryIndustryWuhan95.396.292.796.9Huangshi94.1100.592.195.7Shiyan95.1100.793.296.1Yichang95.3102.392.497.1Xiangyang94.7102.392.795.5Ezhou90.297.283.097.6Jingmen95.0101.192.29...
ShareoftheContributionsoftheThreeStrataofIndustrytotheIncreaseoftheGDP(%)YearGrossDomesticProductPrimaryIndustrySecondIndustryIndustryTertiaryIndustry199210018.246.544.835.3199310013.251.745.935.1199410014.457.953.427.7199510017.753.748.628.619961009.860.955.529.3199710013.752.448.333.91998100-1.661.054.540.619991005.051.147.143...
CompositionofGrossDomesticProductYearTotalOutputPrimarySecondaryIndustryContructionTertiaryBankingRealEstate(%)IndustryIndustryIndustry195210056.715.612.92.727.7195510053.321.818.43.524.9195710049.823.718.55.226.5196210056.220.317.52.923.5196510052.129.124.05.218.8197010050.430.424.75.819.2197510044.737.827.210.717.5197810040.54...
ContributionoftheThreeStrataofIndustrytoGDPGrowth(percentagepoint)YearGrossDomesticProductPrimaryIndustrySecondIndustryIndustryTertiaryIndustry199214.12.56.86.54.8199313.01.76.76.04.6199413.72.07.97.33.8199513.22.37.16.43.8199611.61.17.16.43.4199711.91.66.25.74.119988.6-0.15.24.73.519997.80.44.03.73.420008.60.54.44.03.720018.90....
IndicesofGrossDomesticProduct(precedingyear=100)(%)YearTotalOutputPrimarySecondaryTertiaryPerCapita(%)IndustryIndustryIndustryContructionIndustryBankingRealEstateGDP(%)1953114.0107.4129.4141.093.3122.7111.61955127.1135.5104.9100.2139.2127.1124.81957107.4106.4115.3109.5146.0102.6104.71962100.9112.384.092.750.594.099.01965118.1111...
GrossDomesticProductYearTotalOutput(100PrimarySecondaryIndustryContructionTertiaryBankingRealEstatemillionyuan)IndustryIndustryIndustry195224.5113.903.823.170.666.79195534.0518.147.436.251.208.48195748.8624.3311.569.032.5612.97196252.1329.3010.609.101.5312.23196572.4337.7421.1017.363.8013.59197088.1544.4126.8221.795.1116.9219751...
IndicesofGrossDomesticProduct(yearof1952=100)(%)YearTotalOutputPrimarySecondaryTertiaryPerCapita(%)IndustryIndustryIndustryContructionIndustryBankingRealEstateGDP(%)1953114.0107.4129.4141.093.3122.7111.61955121.6115.7152.3168.4102.2118.2114.41957169.5143.7280.1295.2233.2172.0153.01962141.6129.9223.7257.9116.2124.2119.21965205.61...
MajorPerCapitaIndicatorsofHubei'sItem19902000200520102015地区生产总值GrossDomesticProduct(yuan)1541.006293.0011554.0028163.0151224.05PrimaryIndustry541.001164.001897.003752.255673.61SecondIndustry586.002525.004926.0013752.4623575.28TertiaryIndustry414.002540.004607.0010658.3021975.16地方公共财政预算收入GovernmentRevenue(yuan)145...
ProportionofHubei'sNationalEconomyinChina(2020)指标Item全国湖北CountryHubei土地面积Groundspace(10000sq.km.)960.0018.59年末常住人口Population1411785775地区生产总值LocalGrossProduction(100millionyuan)1015986.243443.46第一产业PrimaryIndustry77754.14131.91第二产业SecondIndustry384255.317023.90第三产业TertiaryIndustry553976.822287.65...
OneDayinHubeiItem200020052010每天创造的财富DailyProduction地区生产总值GrossDomesticProducts9.7117.8644.15(100millionyuan)0.00第一产业PrimaryIndustry1.812.965.88第二产业SecondIndustry3.947.7021.56第三产业TertiaryIndustry3.967.2016.71地方公共财政预算收入GovernmentRevenue(100millionyuan)0.591.032.77粮食Grain(10000tons)6.085.976.31...
CompositionIndicatorsonNationalEconomicandSocialDevelopment(%)Item1978200020052010201820192020人口与就业PopulationandEmployment人口Population城乡结构UrbanandRuralStructure城镇Urban14.640.543.249.760.361.062.9乡村Rural85.459.556.850.339.739.037.1性别结构SexualStructure0.0男Male51.352.151.851.450.850.851.4女Female48.747.948.248.64...
Item197820002005国内商业DomesticTrade社会消费品零售总额结构TotalRetailSalesofConsumerGoods商品零售额RetailSales餐饮收入额FoodandBeverageRevenue对外经济贸易和国际旅游ForeignTradeandTourism进出口总额TotalImportsandExportsExports8.139.851.1Imports91.960.248.9StructureofTouristsForeigners47.379.375.9CompatriotsfromHongkong,MacaoandT...
![[小区点评]金球花园(上海闵行)小区居住环境竞争力评级及房价趋势分析报告(2024版)](https://yunshufang001.oss-cn-shenzhen.aliyuncs.com/convert/202505/29/737238/thumb-P1-f17d798c-dd26-46e0-bb4c-39e9103ea1e1-320x453.webp) [小区点评]金球花园(上海闵行)小区居住环境竞争力评级及房价趋势分析报告(2024版)57234页
[小区点评]金球花园(上海闵行)小区居住环境竞争力评级及房价趋势分析报告(2024版)57234页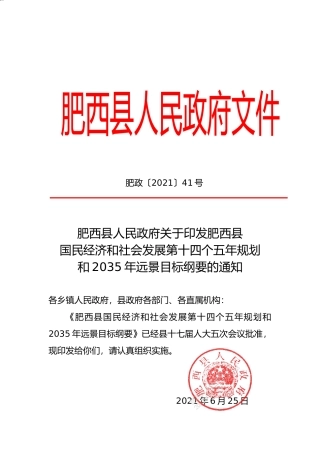 安徽省肥西县十四五发展规划纲要9113页
![[小区点评]朗逸轩(惠州仲恺)小区居住环境竞争力评级及房价趋势分析报告(2024版)](https://yunshufang001.oss-cn-shenzhen.aliyuncs.com/convert/202505/28/703754/thumb-P1-7008a598-9cef-4174-a5d2-7ccacc0e1577-320x453.webp) [小区点评]朗逸轩(惠州仲恺)小区居住环境竞争力评级及房价趋势分析报告(2024版)934页
[小区点评]朗逸轩(惠州仲恺)小区居住环境竞争力评级及房价趋势分析报告(2024版)934页![[小区点评]胜古南里(北京朝阳)小区居住环境竞争力评级及房价趋势分析报告(2024版)](https://yunshufang001.oss-cn-shenzhen.aliyuncs.com/convert/202508/21/743778/thumb-P1-65381ca8-000b-4af7-98ba-9bb502def2f7-320x453.webp) [小区点评]胜古南里(北京朝阳)小区居住环境竞争力评级及房价趋势分析报告(2024版)8658页
[小区点评]胜古南里(北京朝阳)小区居住环境竞争力评级及房价趋势分析报告(2024版)8658页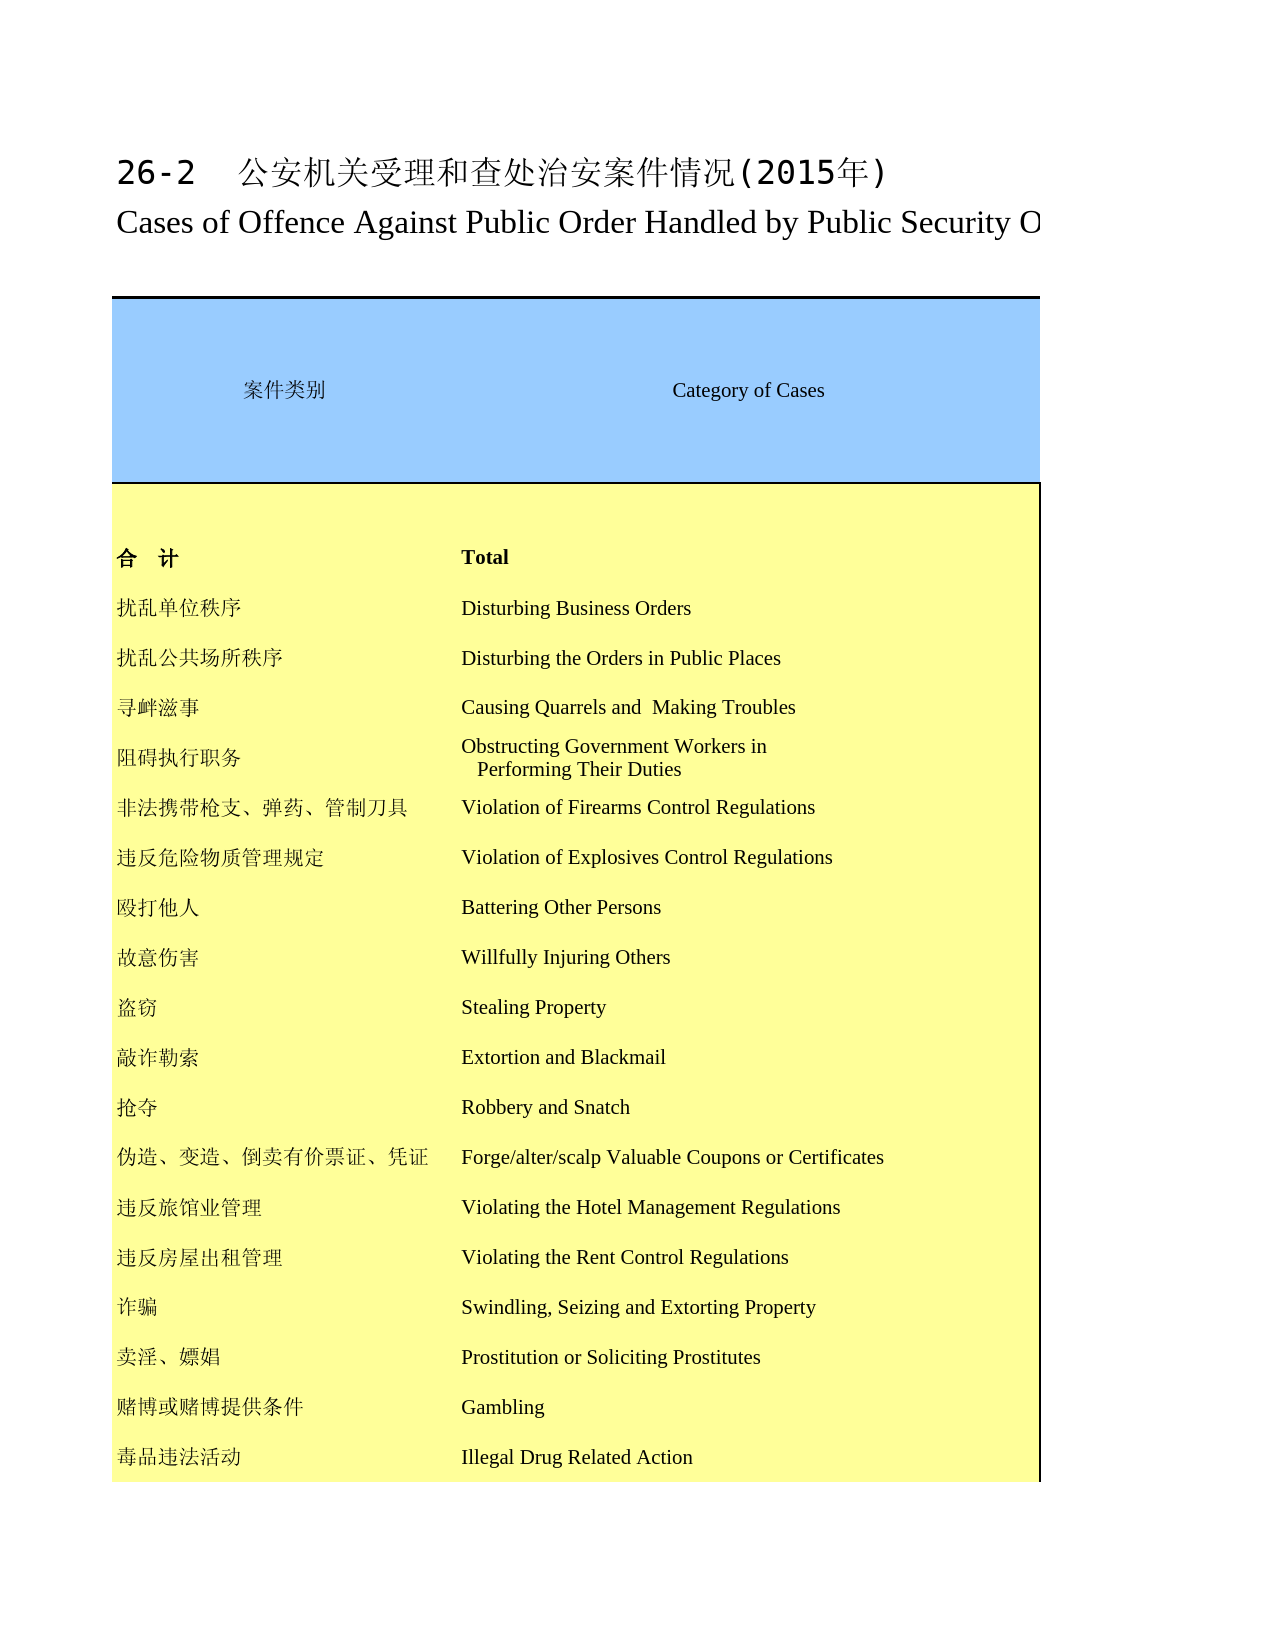 河南统计年鉴2016_ 2602114页
![[专精特新]烟台辉洪塑料制品有限公司行业竞争力评级分析报告(2023版).docx](https://yunshufang001.oss-cn-shenzhen.aliyuncs.com/convert/202509/13/615240/thumb-P1-665c05f8-b6ac-4111-96a8-6f40f8c4cfd2-320x453.webp) [专精特新]烟台辉洪塑料制品有限公司行业竞争力评级分析报告(2023版).docx8116页
[专精特新]烟台辉洪塑料制品有限公司行业竞争力评级分析报告(2023版).docx8116页![[专精特新]上海新平精细化学品有限公司行业竞争力评级分析报告(2023版)](https://yunshufang001.oss-cn-shenzhen.aliyuncs.com/convert/202509/13/633989/thumb-P1-8b2cf305-38af-4176-aac4-8478d028156f-320x453.webp) [专精特新]上海新平精细化学品有限公司行业竞争力评级分析报告(2023版)8112页
[专精特新]上海新平精细化学品有限公司行业竞争力评级分析报告(2023版)8112页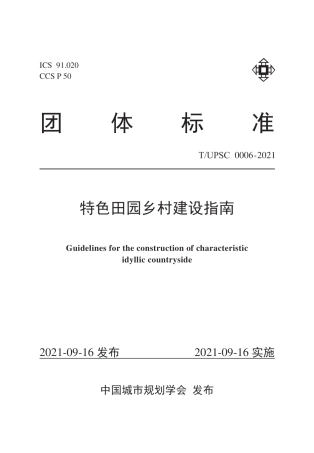 《特色田园乡村建设指南》836页
![[小区点评]麓湖路3号大院(越秀区)住宅小区居住环境竞争力评级及房价趋势分析报告(2024版)](https://yunshufang001.oss-cn-shenzhen.aliyuncs.com/convert/202505/27/670991/thumb-P1-1e538d71-11a4-48be-b182-b951c310816b-320x453.webp) [小区点评]麓湖路3号大院(越秀区)住宅小区居住环境竞争力评级及房价趋势分析报告(2024版)857页
[小区点评]麓湖路3号大院(越秀区)住宅小区居住环境竞争力评级及房价趋势分析报告(2024版)857页![[小区点评]百合山庄(龙岗区)小区居住环境竞争力评级及房价趋势分析报告(2024版)](https://yunshufang001.oss-cn-shenzhen.aliyuncs.com/convert/202505/28/679483/thumb-P1-64e2c313-39e4-42a4-b577-1efb00d82e09-320x453.webp) [小区点评]百合山庄(龙岗区)小区居住环境竞争力评级及房价趋势分析报告(2024版)859页
[小区点评]百合山庄(龙岗区)小区居住环境竞争力评级及房价趋势分析报告(2024版)859页![[国家法规] 中华人民共和国城镇集体所有制企业条例](https://yunshufang001.oss-cn-shenzhen.aliyuncs.com/202305/20/164331/P1-1c6ce732-5167-4e9c-90c7-66a991e253b3.png) [国家法规] 中华人民共和国城镇集体所有制企业条例59420页
[国家法规] 中华人民共和国城镇集体所有制企业条例59420页![[推荐国标] GB_T 10781.1-2021 白酒质量要求 第1部分:浓香型白酒](https://yunshufang001.oss-cn-shenzhen.aliyuncs.com/202305/29/203842/P1-f9b77e15-9bd6-4547-a529-c7618dc50092.png) [推荐国标] GB_T 10781.1-2021 白酒质量要求 第1部分:浓香型白酒99013页
[推荐国标] GB_T 10781.1-2021 白酒质量要求 第1部分:浓香型白酒99013页![[小区点评]中旅国际公馆(一期)(福田区)小区居住环境竞争力评级及房价趋势分析报告(2024版)](https://yunshufang001.oss-cn-shenzhen.aliyuncs.com/convert/202505/28/678791/thumb-P1-f13d2f31-eec0-4128-99a5-2c06341846b7-320x453.webp) [小区点评]中旅国际公馆(一期)(福田区)小区居住环境竞争力评级及房价趋势分析报告(2024版)1860页
[小区点评]中旅国际公馆(一期)(福田区)小区居住环境竞争力评级及房价趋势分析报告(2024版)1860页![[小区点评]江南水乡(温州市瑞安市)小区居住环境竞争力评级及房价趋势分析报告(2024版)](https://yunshufang001.oss-cn-shenzhen.aliyuncs.com/convert/202502/21/774729/thumb-P1-36fe475d-af8a-44cf-861e-e34aee034fc5-320x453.webp) [小区点评]江南水乡(温州市瑞安市)小区居住环境竞争力评级及房价趋势分析报告(2024版)7163页
[小区点评]江南水乡(温州市瑞安市)小区居住环境竞争力评级及房价趋势分析报告(2024版)7163页![[小区点评]北京市小区房价趋势及典型小区居住环境竞争力评级及房价趋势分析报告(2024版)](https://yunshufang001.oss-cn-shenzhen.aliyuncs.com/convert/202508/26/825080/thumb-P1-5f2ba34c-de29-4298-988b-2c86e6069b5e-320x453.webp) [小区点评]北京市小区房价趋势及典型小区居住环境竞争力评级及房价趋势分析报告(2024版)29220页
[小区点评]北京市小区房价趋势及典型小区居住环境竞争力评级及房价趋势分析报告(2024版)29220页![[工业企业评级排名]中国专精特新企业行业竞争力评级分析报告(2023版)(样本预览)](https://yunshufang001.oss-cn-shenzhen.aliyuncs.com/convert/202508/26/825083/thumb-P1-2987c4a9-02b8-47a5-b3ec-9f3ee4763fb9-320x453.webp) [工业企业评级排名]中国专精特新企业行业竞争力评级分析报告(2023版)(样本预览)754111页
[工业企业评级排名]中国专精特新企业行业竞争力评级分析报告(2023版)(样本预览)754111页![[小区点评]苏州市小区房价趋势及典型小区居住环境竞争力评级及房价趋势分析报告(2024版)](https://yunshufang001.oss-cn-shenzhen.aliyuncs.com/convert/202508/25/825078/thumb-P1-696169d7-7bba-4970-a9ac-bf814aabbd1f-320x453.webp) [小区点评]苏州市小区房价趋势及典型小区居住环境竞争力评级及房价趋势分析报告(2024版)17323页
[小区点评]苏州市小区房价趋势及典型小区居住环境竞争力评级及房价趋势分析报告(2024版)17323页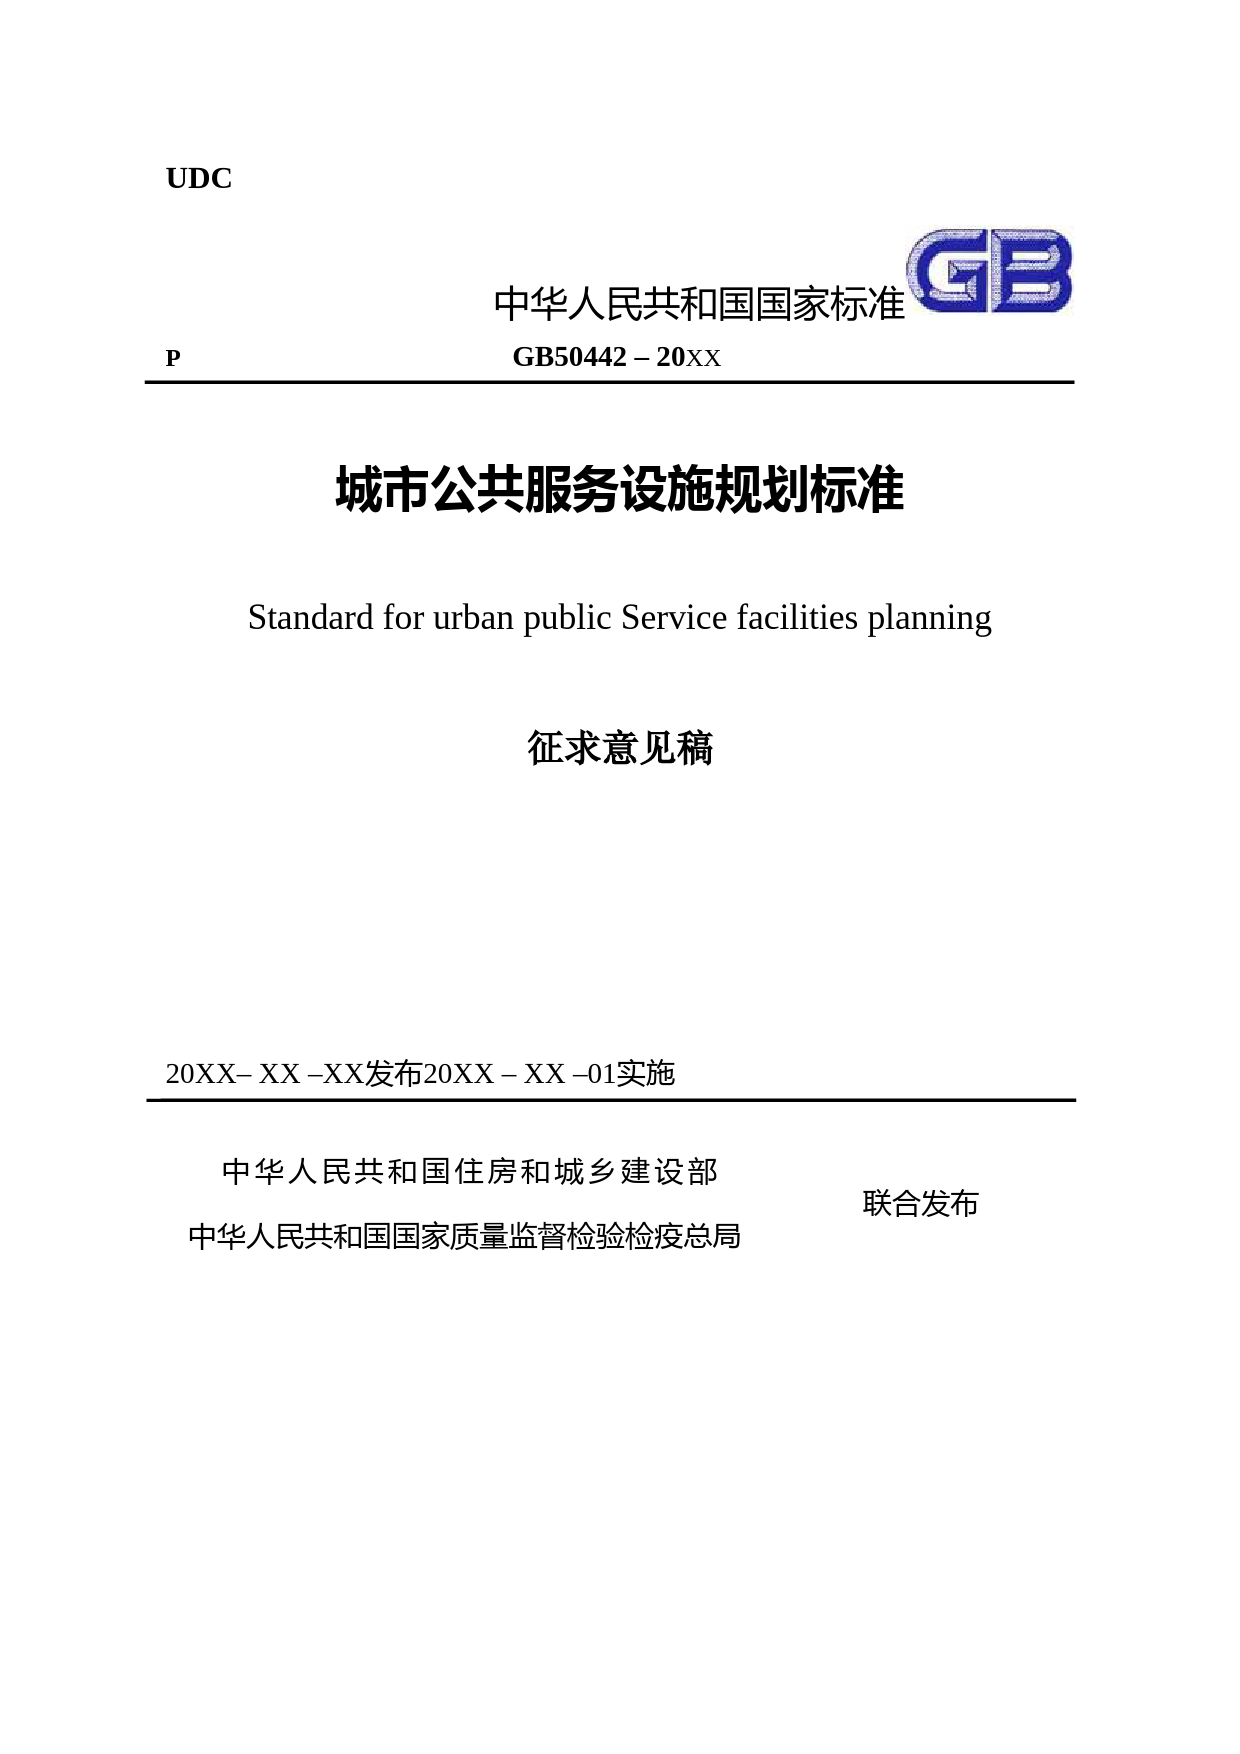 城市公共服务设施规划标准GB50442(修订)(征求意见稿)34679页
![[推荐国标] GB_T 1536-2021 菜籽油(含第1号修改单)](https://yunshufang001.oss-cn-shenzhen.aliyuncs.com/202305/29/204232/P1-1c2c7fcf-0442-4836-a1a9-de237d1442d0.png) [推荐国标] GB_T 1536-2021 菜籽油(含第1号修改单)5419页
[推荐国标] GB_T 1536-2021 菜籽油(含第1号修改单)5419页![[推荐国标] GB_T 40851-2021 食用调和油](https://yunshufang001.oss-cn-shenzhen.aliyuncs.com/202305/29/204283/P1-b5381a82-ac4c-4f7a-bfb6-c11b28239331.png) [推荐国标] GB_T 40851-2021 食用调和油40916页
[推荐国标] GB_T 40851-2021 食用调和油40916页