5-3INVESTMENTINFIXEDASSETSBYINDUSTRY(1985-2007)YearTotalInvestmentPrimarySecondaryIndustryTertiaryEnergyIndustryinFixedAssetsIndustryIndustry198594.01.632.428.84.443.81986-1990724.19.4218.8209.143.1384.21986106.21.541.438.85.551.61987136.21.646.944.310.072.91988163.02.048.847.29.987.91989139.51.938.437.08.581.91990179.22.443.341...

5-2INVESTMENTINFIXEDASSETSANDITSINCREMENTALFIXEDBYURBANAREAANDRURALAREA(1985-2007)YearTotalInvestmentUrbanRealEstateRuralinFixedAssetsFixedAssetsDevelopmentInvestmentInvestment198594.077.814.61986-1990724.1634.922.576.51986106.294.510.41987136.2121.412.71988163.0138.721.31989139.5122.214.71990179.2158.122.517.41991-19952358.7218...

4-17GARDENSANDPLANTEDAREAS(2000-2007)Item2000200120022003ParkGreenAreas(year-end)(hectare)7139755479079115PerCapitaParkGreenAreas(sq.m/person)9.6610.0710.6611.43CoverageofCityGreenAreas(%)36.5438.7840.5740.87CoverageofCityForest(%)42.044.045.547.5GreenAreas(year-end)(hectare)26680302243257238475Source:BeijingMunicipalBureauofLandscapeandForestry.REAS(2000-2007)20042005200620071044611365117881210111.4512.0012.0012.6041.9142.042.543.049.550.551.051.636755388774549546320

4-15MUNICIPALENVIRONMENTANDSANITATIONItem20072006WorkLoadAreaUnderCleaningProgram(10000sq.m/day)1174110022OutputofDomesticGarbage(10000tons)619.5585.1DomesticGarbageClearedandTransported(10000tons)600.9538.2VolumeofHarmlessDisposalofGarbage(10000tons)575.1497.7RateofHarmlessDisposalofDomesticGarbage(%)95.792.5VolumeofExcrementan...

4-16ENVIRONMENTPROTECTIONItem20072006WaterEnvironmentIndustrialWasteWaterDischargeVolume(10000tons)9134.2510169.92CODDischargeVolume(ton)106500109866AtmosphereEnvironment(ton)151661.2175544.4SmokeandDustDischargeVolume(ton)48482.549594.1IndustrialPowderDustDischargeVolume(ton)19306.630131.7(%)67.466.0SolidWasteIndustrialSolidWas...

4-14ACOUSTICALENVIRONMENT(2000-2007)Item20002001200220032004EnvironmentNoiseMeanin8DistrictsofBeijing(db)53.953.953.553.653.8TrafficTrunkNoiseMeanin8DistrictsofBeijing(db)71.069.669.569.769.6Sources:StateEnvironmentalProtectionAdministrationofBeijing.2007)20052006200753.253.954.069.569.769.9

4-12WATERDRAINAGEANDSAVINGItem20072006WaterDrainageDisposalCapacity(10000cu.m/day)353331Grade-IIandIIIDisposal(10000cu.m/day)313311AnnualDisposalVolume(10000cu.m)9886593198Grade-IIandIIIDisposal(10000cu.m)9030288554RateofWasteWaterDisposed(%)76.273.8RateofConcentratedDisposal(%)69.668.6TotalVolumeofWasteWaterDrainage(10000cu.m)1...

4-13ATMOSPHEREENVIRONMENT(2000-2007)Item2000200120022003200420052006DaysinwhichtheairqualitywasatandbetterthanGradeII(day)177185203224229234241DailyMeanofInspiratoryGranule(mg/cu.m)0.1620.1650.1660.1410.1490.1420.161intheYearDailyMeanofSulfurDioxideintheYear(mg/cu.m)0.0710.0640.0670.0610.0550.0500.053DailyMeanofNitrogenDioxide(mg/cu.m)0.0710.0710.0760.0720.0710.0660.066intheYearSource:StateEnvironmentalProtectionAdministrationofBeijing.20072460.1480.0470.066

4-10AVERAGEDAILYENERGYCONSUMPTIONBYVARIETYItemAverageDailyEnergyConsumption20072006Total(10000tonsofSCE)17.216.2Coal(10000tons)8.28.4Coke(10000tons)1.01.0CrudeOil(10000tons)2.62.2Gasoline(10000tons)0.90.8Kerosene(10000tons)0.80.6DieselOil(10000tons)0.50.5FuelOil(10000tons)0.10.1Electricity(100millionkwh)1.81.7NaturalGas(100millioncu.m)0.10.1

4-11STATISTICSONWATERRESOURCE(2001-2007)Item200120022003TotalVolumeofWaterResourceintheYear19.216.118.4VolumeofSurfaceWaterResource7.85.36.1VolumeofUndergroundWaterResource15.714.714.8Per-capitaWaterResource(cu.m)139.7114.7127.8TotalVolumeofWaterUsedintheYear38.934.635.8SurfaceWater11.710.48.3UndergroundWater27.224.225.4Other2.1...

4-9PERCAPITAENERGYCONSUMPTIONFORNON-PRODUCTIONPURPOSEItemNon-productionConsumptionPerCapita20072006Total(kgofSCE)625.5583.2Coal(kg)172.4171.0Electricity(kwh)663.8614.7LiquefiedPetroleumGas(kg)17.215.3NaturalGas(cu.m)55.953.9Note:Thistableisbaseduponaveragenumberofpermanentresidents.

4-6continued1ItemTotalEnergyConsumptionCoalCoke(10000tonsofSCE)SmeltingandPressingofFerrousMetals676.76392.88345.48SmeltingandPressingofNon-FerrousMetals7.240.980.29ManufactureofMetalProducts25.456.640.23ManufactureofGeneralPurposeMachinery34.138.443.36ManufactureofSpecialPurposeMachinery31.7119.010.46ManufactureofTransportEquip...

4-7ELASTICITYCOEFFICIENTOFENERGYCONSUMPTION(2002-2007)Item20022003200420054.904.8010.607.40GrowthRateofEnergyConsumptionoverPrecedingYear9.505.7010.6011.16GrowthRateofElectricityConsumptionoverPrecedingYear11.511.014.1011.80GrowthRateofGrossDomesticProduct(GDP),overPrecedingYear0.430.440.750.63ElasticityRatioofEnergyConsumption0.830.520.750.94ElasticityCoefficientofElectricityConsumptionON(2002-2007)200620076.926.458.499.0612.8413.340.540.480.660.68

4-8ENERGYCONSUMPTIONPER10000YUANGROSSDOMESTICPRODUCT(2002-2007)Item200220032004200520062007Total(tonsofSCE)1.020.930.850.800.750.67Coal(ton)0.600.550.490.450.390.32Electricity(10000kwh)0.100.090.080.080.080.07Petroleum(ton)0.160.130.160.160.150.14

4-5ENERGYBALANCE(PHYSICALVOLUME)(ABRIDGEDEDITION)ItemCoalCleanOtherCoalCokeCokingCoalWashingProductsGasCoal(100millioncu.m)TotalEnergyAvailablefor2391.45228.278.667.85179.540.72ConsumptionInput(-)orOutput(+)inProce-1355.63-221.83-7.06-7.6958.066.96-ssingandTransformationThermalPower-816.17-5.76-7.93-0.07Heating-513.62-1.30-20.91...

4-4ELECTRICITYBALANCE(2004-2007)(100millionkwh)Item200420052006TotalEnergyAvailablefor308.50358.26409.33ConsumptionInput(-)orOutput(+)inProce200.40209.80209.65-ssingandTransformationThermalPower200.40209.80209.65HeatingWashing-dressingCoalCokingPetroleumRefiningGasProductionCokeRe-input(-)CoalProductsProcessingLosses40.6541.2343...

4-6CONSUMPTIONOFTOTALENERGYANDITSMAINVARIETIESBYSECTOR(2007)ItemTotalEnergyConsumptionCoalCokeGasoline(10000tonsofSCE)Total6285.042990.11358.19324.72Farming,Forestry,AnimalHusbandryandFishery96.4450.910.004.91Mining29.188.973.230.31MiningandWashingofCoal7.252.510.000.15ExtractionofPetroleumandNaturalGas1.840.000.000.04MiningandP...

4-3COMPREHENSIVEENERGYBALANCE(STANDARDVOLUME)(2004-2007)Item200420052006TotalEnergyAvailablefor5169.575481.045650.63ConsumptionInput(-)orOutput(+)inProce-35.52-15.29-27.81-ssingandTransformationThermalPowerHeatingWashing-dressingCoalCoking-35.24-15.29-12.82PetroleumRefining-0.05-13.62GasProduction139.97131.64116.98CokeRe-input(-...

4-1PRODUCTIONOFENERGYItem200420052006PrimaryEnergy(10000tonofSCE)765.0679.5460.6Coal(10000tons)1067.9945.2642.1SecondaryEnergy(10000tonofSCE)2850.82832.12714.4Gasoline(10000tons)169.8156.5159.3Kerosene(10000tons)8.112.411.6DieselOil(10000tons)180.7176.8185.9FuelOil(10000tons)68.268.964.0LiquefiedPetroleumGas(10000tons)43.347.340...

4-2TOTALENERGYCONSUMPTIONANDENERGYCONSUMPTIONPER10000YUANGDP(1996-2007)(10000tonofSCE)YearTotalEnergyConsumptionEnergyConsumptionDecreaseRateofTerminalConsumptionper10000yuanGDPEnergyConsumption(tonofSCE)per10000yuanGDP(%)19963734.53578.42.092.7519973719.23568.31.799.6019983808.13654.91.606.8819993906.63749.01.467.3820004144.039...
![[城市房价]北京市房价趋势分析报告(2025年4月版)-西城区](https://yunshufang001.oss-cn-shenzhen.aliyuncs.com/convert/202505/23/798767/thumb-P1-0950daa9-da49-415b-8cb6-8e3e8d0406f1-320x453.webp) [城市房价]北京市房价趋势分析报告(2025年4月版)-西城区11927页
[城市房价]北京市房价趋势分析报告(2025年4月版)-西城区11927页![[小区点评]胜古南里(北京朝阳)小区居住环境竞争力评级及房价趋势分析报告(2024版)](https://yunshufang001.oss-cn-shenzhen.aliyuncs.com/convert/202508/21/743778/thumb-P1-65381ca8-000b-4af7-98ba-9bb502def2f7-320x453.webp) [小区点评]胜古南里(北京朝阳)小区居住环境竞争力评级及房价趋势分析报告(2024版)8658页
[小区点评]胜古南里(北京朝阳)小区居住环境竞争力评级及房价趋势分析报告(2024版)8658页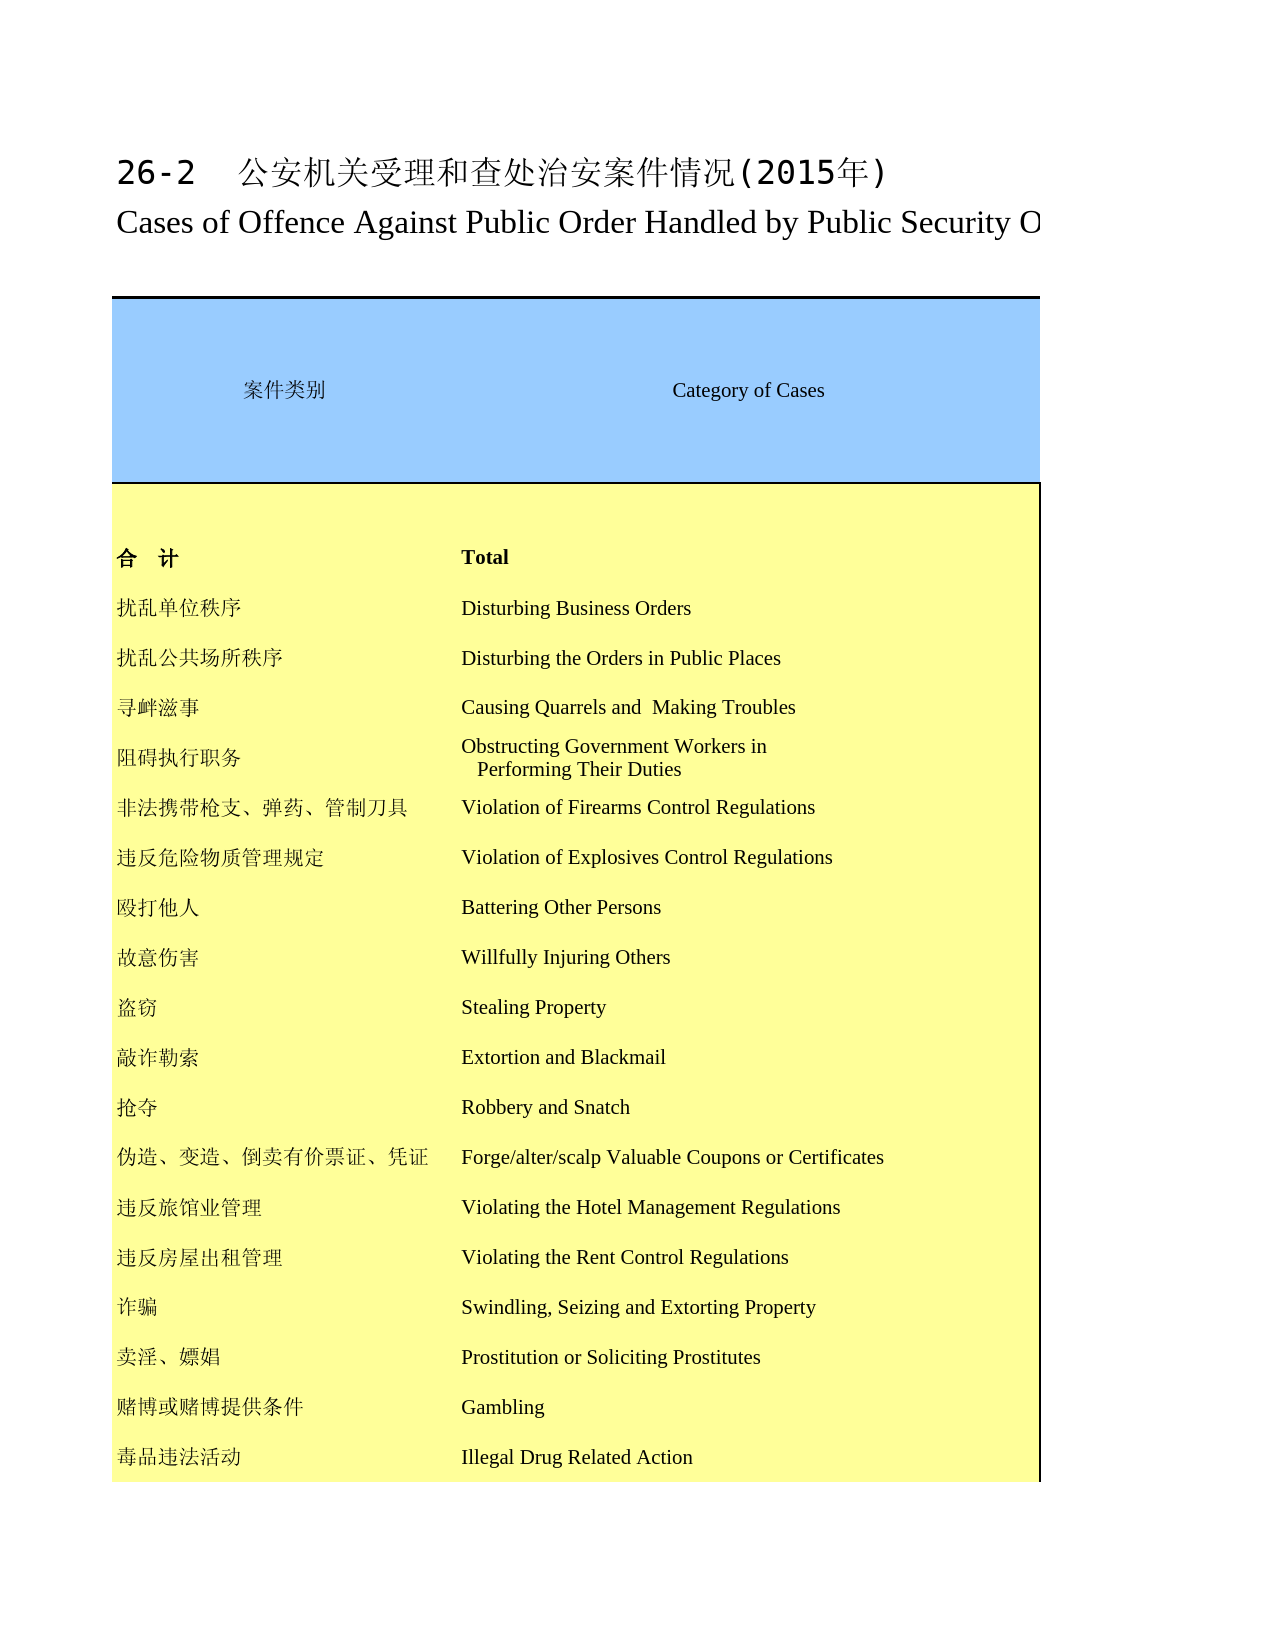 河南统计年鉴2016_ 2602114页
![[专精特新]上海新平精细化学品有限公司行业竞争力评级分析报告(2023版)](https://yunshufang001.oss-cn-shenzhen.aliyuncs.com/convert/202509/13/633989/thumb-P1-8b2cf305-38af-4176-aac4-8478d028156f-320x453.webp) [专精特新]上海新平精细化学品有限公司行业竞争力评级分析报告(2023版)8112页
[专精特新]上海新平精细化学品有限公司行业竞争力评级分析报告(2023版)8112页 《特色田园乡村建设指南》836页
![[小区点评]麓湖路3号大院(越秀区)住宅小区居住环境竞争力评级及房价趋势分析报告(2024版)](https://yunshufang001.oss-cn-shenzhen.aliyuncs.com/convert/202505/27/670991/thumb-P1-1e538d71-11a4-48be-b182-b951c310816b-320x453.webp) [小区点评]麓湖路3号大院(越秀区)住宅小区居住环境竞争力评级及房价趋势分析报告(2024版)857页
[小区点评]麓湖路3号大院(越秀区)住宅小区居住环境竞争力评级及房价趋势分析报告(2024版)857页![[小区点评]百合山庄(龙岗区)小区居住环境竞争力评级及房价趋势分析报告(2024版)](https://yunshufang001.oss-cn-shenzhen.aliyuncs.com/convert/202505/28/679483/thumb-P1-64e2c313-39e4-42a4-b577-1efb00d82e09-320x453.webp) [小区点评]百合山庄(龙岗区)小区居住环境竞争力评级及房价趋势分析报告(2024版)859页
[小区点评]百合山庄(龙岗区)小区居住环境竞争力评级及房价趋势分析报告(2024版)859页![[小区点评]东方明珠城(龙岗区)小区居住环境竞争力评级及房价趋势分析报告(2024版)](https://yunshufang001.oss-cn-shenzhen.aliyuncs.com/convert/202505/28/681400/thumb-P1-7f09a123-caf6-42ee-8e91-cce7a101d4c7-320x453.webp) [小区点评]东方明珠城(龙岗区)小区居住环境竞争力评级及房价趋势分析报告(2024版)859页
[小区点评]东方明珠城(龙岗区)小区居住环境竞争力评级及房价趋势分析报告(2024版)859页![[小区点评]安亭中央公园(公寓住宅)(上海嘉定)小区居住环境竞争力评级及房价趋势分析报告(2024版)](https://yunshufang001.oss-cn-shenzhen.aliyuncs.com/convert/202505/29/718371/thumb-P1-58d22179-470a-425d-8267-9244fb675378-320x453.webp) [小区点评]安亭中央公园(公寓住宅)(上海嘉定)小区居住环境竞争力评级及房价趋势分析报告(2024版)1330335页
[小区点评]安亭中央公园(公寓住宅)(上海嘉定)小区居住环境竞争力评级及房价趋势分析报告(2024版)1330335页![[小区点评]彩电宿舍(北京海淀)小区居住环境竞争力评级及房价趋势分析报告(2024版)](https://yunshufang001.oss-cn-shenzhen.aliyuncs.com/convert/202508/21/743782/thumb-P1-fd567665-baa0-475a-a568-3e957c84efda-320x453.webp) [小区点评]彩电宿舍(北京海淀)小区居住环境竞争力评级及房价趋势分析报告(2024版)66257页
[小区点评]彩电宿舍(北京海淀)小区居住环境竞争力评级及房价趋势分析报告(2024版)66257页![[工业企业评级排名]中国专精特新企业行业竞争力评级分析报告(2023版)(样本预览)](https://yunshufang001.oss-cn-shenzhen.aliyuncs.com/convert/202508/26/825083/thumb-P1-2987c4a9-02b8-47a5-b3ec-9f3ee4763fb9-320x453.webp) [工业企业评级排名]中国专精特新企业行业竞争力评级分析报告(2023版)(样本预览)1066111页
[工业企业评级排名]中国专精特新企业行业竞争力评级分析报告(2023版)(样本预览)1066111页![[小区点评]中旅国际公馆(一期)(福田区)小区居住环境竞争力评级及房价趋势分析报告(2024版)](https://yunshufang001.oss-cn-shenzhen.aliyuncs.com/convert/202505/28/678791/thumb-P1-f13d2f31-eec0-4128-99a5-2c06341846b7-320x453.webp) [小区点评]中旅国际公馆(一期)(福田区)小区居住环境竞争力评级及房价趋势分析报告(2024版)1860页
[小区点评]中旅国际公馆(一期)(福田区)小区居住环境竞争力评级及房价趋势分析报告(2024版)1860页![[小区点评]江南水乡(温州市瑞安市)小区居住环境竞争力评级及房价趋势分析报告(2024版)](https://yunshufang001.oss-cn-shenzhen.aliyuncs.com/convert/202502/21/774729/thumb-P1-36fe475d-af8a-44cf-861e-e34aee034fc5-320x453.webp) [小区点评]江南水乡(温州市瑞安市)小区居住环境竞争力评级及房价趋势分析报告(2024版)7163页
[小区点评]江南水乡(温州市瑞安市)小区居住环境竞争力评级及房价趋势分析报告(2024版)7163页![[推荐国标] GB_T 20977-2007 糕点通则](https://yunshufang001.oss-cn-shenzhen.aliyuncs.com/202305/28/201710/P1-edf88c8a-787d-4203-8765-11bf295da5c5.png) [推荐国标] GB_T 20977-2007 糕点通则79810页
[推荐国标] GB_T 20977-2007 糕点通则79810页![[推荐国标] GB_T 10781.2-2022 白酒质量要求 第2部分:清香型白酒](https://yunshufang001.oss-cn-shenzhen.aliyuncs.com/202305/29/203985/P1-8f6cc700-cd5f-428c-90a8-58084704d8fe.png) [推荐国标] GB_T 10781.2-2022 白酒质量要求 第2部分:清香型白酒8378页
[推荐国标] GB_T 10781.2-2022 白酒质量要求 第2部分:清香型白酒8378页 10元收款码(仅用于相关项目收款使用)165871页
 GB+1499.2-2024钢筋混凝土用钢 第2部分:热轧带肋钢筋6723页
![[小区点评]首开熙悦山澜庭(北京房山)小区居住环境竞争力评级及房价趋势分析报告(2024版)](https://yunshufang001.oss-cn-shenzhen.aliyuncs.com/convert/202508/21/746761/thumb-P1-722d5750-8202-429b-9d38-ee5b554e4236-320x453.webp) [小区点评]首开熙悦山澜庭(北京房山)小区居住环境竞争力评级及房价趋势分析报告(2024版)11958页
[小区点评]首开熙悦山澜庭(北京房山)小区居住环境竞争力评级及房价趋势分析报告(2024版)11958页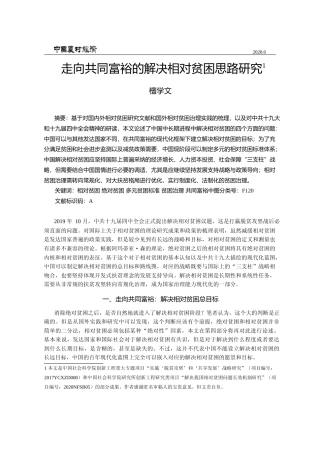 走向共同富裕的解决相对贫困思路研究_檀学文30317页
 GB_T 25499-2010 城市污水再生利用 绿地灌溉水质379页