CompositionofGrossDomesticProductbyIndustries资料来源:世界银行数据库。Source:WorldBankDatabase.国家和地区CountryorArea第一产业第二产业PrimaryIndustrySecondaryIndustry200020072000世界World3.629.2低收入国家LowIncome30.624.824.1最不发达国家LeastDevelopedCountries32.924.823.6重债穷国HeavilyIndebtedPoorCountries32.027.723.5中等收入...

GrossDomesticProductbyProductionApproach资料来源:联合国数据库。Source:UNDatabase.单位:亿本币国家和地区CountryorArea中国China按当年价格计算InCurrentPrices农业、狩猎业和林业;渔业Agriculture,HuntingandForestry;Fishing采掘业MiningandQuarrying制造业Manufacturing电、煤气和水供应业Electricity,GasandWaterSupply建筑业Construction批发...

ConsumptionRate资料来源:世界银行数据库。Source:WorldBankDatabase.(%)国家和地区CountryorArea19902000200420052006中国China60.162.554.250.647.7中国香港HongKong,China64.368.169.367.066.9孟加拉国Bangladesh90.482.281.381.981.6文莱BruneiDarussalam56.855.449.545.843.5柬埔寨Cambodia98.494.489.688.685.5印度India77.376.870.268.367.0印度尼...

CapitalFormationRate资料来源:世界银行数据库。国家和地区CountryorArea199020002004世界World23.522.321.4低收入国家LowIncome17.419.521.7最不发达国家LeastDevelopedCountries15.919.722.1重债穷国HeavilyIndebtedPoorCountries15.418.920.4中等收入国家MiddleIncome26.324.126.6下中等收入国家LowerMiddleIncome30.728.133.5上中等收入国家UpperMidd...

ShareoftheContributionsoftheThreeStrataofIndustrytotheIncreaseoftheGDP资料来源:世界银行数据库。国家和地区CountryorArea第一产业第二产业PrimarySecondary2000200720002007中国China4.53.650.955.0中国香港HongKong,China-0.1-1.1孟加拉国Bangladesh30.110.325.640.8柬埔寨Cambodia-1.764.5印度India-1.48.636.523.3印度尼西亚Indonesia6.17.954.53...

资料来源:世界银行数据库。国家和地区资本形成总额消费支出GrossCapitalFinalConsumptionCountryorAreaFormationExpenditure2000200720002007中国China16.150.365.310.0中国香港HongKong,China56.033.247.075.0孟加拉国Bangladesh28.830.769.464.1柬埔寨Cambodia24.578.7印度India-29.548.288.555.5印度尼西亚Indonesia70.67.510.485.7伊朗Iran49.864.666...

GrowthRateofGDPperCapita资料来源:世界银行数据库。Source:WorldBankDatabase.国家和地区CountryorArea200020032004世界World2.81.42.9低收入国家LowIncome1.62.84.6最不发达国家LeastDevelopedCountries2.02.34.2重债穷国HeavilyIndebtedPoorCountries0.61.22.7中等收入国家MiddleIncome4.24.46.5下中等收入国家LowerMiddleIncome4.76.47.1上中等收入国...

GrowthRateofGDPSource:InternationalMonetaryFundDatabase.国家和地区CountryorArea199020002004世界①2.94.74.9发达国家AdvancedCountries3.04.03.2欧盟EuropeanUnion2.43.92.7欧元区EuroArea3.82.1主要发达国家MajorAdvancedCountries2.83.62.9亚洲新兴工业化国家NewlyIndustrializedAsian7.47.75.9其它发达国家②4.45.94.9发展中国家DevelopingCountri...

MainEconomicIndicatorsofNationalAccountsBasedonPPP(2007)资料来源:世界银行数据库。Source:WorldBankDatabase.国家和地区CountryorArea国内生产总值人均国内生产总值GDPGDPperCapita(100million(currentinternational$)international$)世界World6543519896低收入国家LowIncome197271522最不发达国家①97131215重债穷国HeavilyIndebtedPoorCountries720...

GrossDomesticProduct(USD)资料来源:世界银行数据库。Source:WorldBankDatabase.单位:亿美元国家和地区CountryorArea199020002004世界总计World218773319492417324低收入国家LowIncome263337035188最不发达国家①LeastDevelopedCountries152618532670重债穷国HeavilyIndebtedPoorCountries134114472072中等收入国家MiddleIncome354895647078235中下等收...

GrossDomesticProduct(localcurrency)Source:InternationalMonetaryFundDatabase.单位:亿本币①国家和地区CountryorArea1990200020042005中国China1866899215159878183218中国香港HongKong,China5990131771291913826阿富汗②25803222孟加拉国②10542245323518439322文莱BruneiDarussalam64103133159柬埔寨Cambodia7375140826214383257543印度India5491420...

GNIPerCapita(USD)资料来源:世界银行数据库。Source:WorldBankDatabase.单位:美元国家和地区CountryorArea199020002004世界总计World408252636348低收入国家LowIncome309320410最不发达国家①299269338重债穷国HeavilyIndebtedPoorCountries340278337中等收入国家MiddleIncome96913881810中下等收入国家LowerMiddleIncome5228491231中上等收入国家UpperM...

AirPollutioninMajorCitiesoftheWorldSource:WorldBankWorldDevelopmentIndicators2008.国家和地区城市City城市人口总悬浮颗粒物CountryUrbanTotalSuspendedorPopulationParticulatesArea(10000persons)(microgramper2005cubicmeter)2004中国China上海Shanghai145073北京Beijing107289天津Tianjin704125印度India孟买Mumbai182063德里Delhi1505150加尔各答...

ForestationSource:WorldBankWorldDevelopmentIndicators2008.(国家或地区CountryorArea森林平均消失率森林覆盖率AverageAnnualForestAreaasPercentageofLandAreDeforestationRate1990-20002000-20052000世界总计World1.51.730.81高收入国家HighIncome29.13中等收入国家MiddleIncome33.01低收入国家LowIncome25.66中国China–0.4–0.418.98孟加拉国Banglad...

NationallyProtectedAreasandBiodiversitySource:WorldBankWorldDevelopmentIndicators2008.WorldBankDatababse.国家和地区CountryorArea国家保护区面积NationallyProtectedAreasMammals占土地总面积物种濒危物种SpeciesThreatenedAreaasPercentageSpecies(10000ofTotal20042007sq.km)Land(%)20042004中国China110.111.81801351中国香港HongKong,China0.03...

FreshwaterSource:WorldBankWorldDevelopmentIndicators2008.国家或地区CountryorArea淡水资源总淡水抽取量占水FreshwaterWTotalFreshwaterAnnualFreshwaterin1987-2ResourceperWithdrawals用于农业Capita(cu.m.)asPercentageofforTotalResources(%)Agriculture世界总计World67949.170高收入国家HighIncome964010.242中等收入国家MiddleIncome86776.371低...

ParticulateMatterContentPerCubicMeterintheAir(PMDiameterLessThan10M资料来源:世界银行数据库。Source:WorldBankDatabase.(microgr国家和地区CountryorArea2000200120022003世界World63.3761.5660.3457.84中国China84.5279.3278.3379.43孟加拉国Bangladesh162.46162.28157.85149.94文莱BruneiDarussalam54.4747.8247.1547.28柬埔寨Cambodia69.7267.366...

NitrousOxideandOtherGreenhouseGasEmissions资料来源:世界银行数据库。Sources:WorldbankDatabase.国家和地区CountryorArea氮的排放量农业生产氮排放量比重(千吨二氧化碳当量)(%)NitrousOxideEmissionsAgricultural%(totalthousandmetrictonsofofTotalcarbondioxideequivalent)199020052005世界World89701016097.1低收入国家LowIncome3323000378780047...

EmissionsofCarbonDioxideSource:WorldBankWorldDevelopmentIndicators2008.国家和地区CountryorAreaTotalEmissionsPerCapitaEmissions(millionmetrictons)(metrictons)1990200419902004世界World22695.928974.34.34.5中国China2398.25005.72.13.9孟加拉国Bangladesh15.437.10.10.2柬埔寨Cambodia0.50.5印度India681.51341.80.81.2印度尼西亚Indonesia213....

CarbonDioxideandMethaneEmissionsSources:WorldbankDatabase,WorldDevelopmentIndicators2008.国家和地区CountryorArea二氧化碳排放年均增长(%)MethaneEmissionsCarbonDioxideEmissions(totalthousandmetricAverageAnnual%Growthtonsofcarbondioxideequivalent)1970–19901990–20041990世界World3.3–3.110850低收入国家LowIncome1.81.66174140中等收入...
![[城市房价]北京市房价趋势分析报告(2025年4月版)-西城区](https://yunshufang001.oss-cn-shenzhen.aliyuncs.com/convert/202505/23/798767/thumb-P1-0950daa9-da49-415b-8cb6-8e3e8d0406f1-320x453.webp) [城市房价]北京市房价趋势分析报告(2025年4月版)-西城区11927页
[城市房价]北京市房价趋势分析报告(2025年4月版)-西城区11927页![[小区点评]胜古南里(北京朝阳)小区居住环境竞争力评级及房价趋势分析报告(2024版)](https://yunshufang001.oss-cn-shenzhen.aliyuncs.com/convert/202508/21/743778/thumb-P1-65381ca8-000b-4af7-98ba-9bb502def2f7-320x453.webp) [小区点评]胜古南里(北京朝阳)小区居住环境竞争力评级及房价趋势分析报告(2024版)8658页
[小区点评]胜古南里(北京朝阳)小区居住环境竞争力评级及房价趋势分析报告(2024版)8658页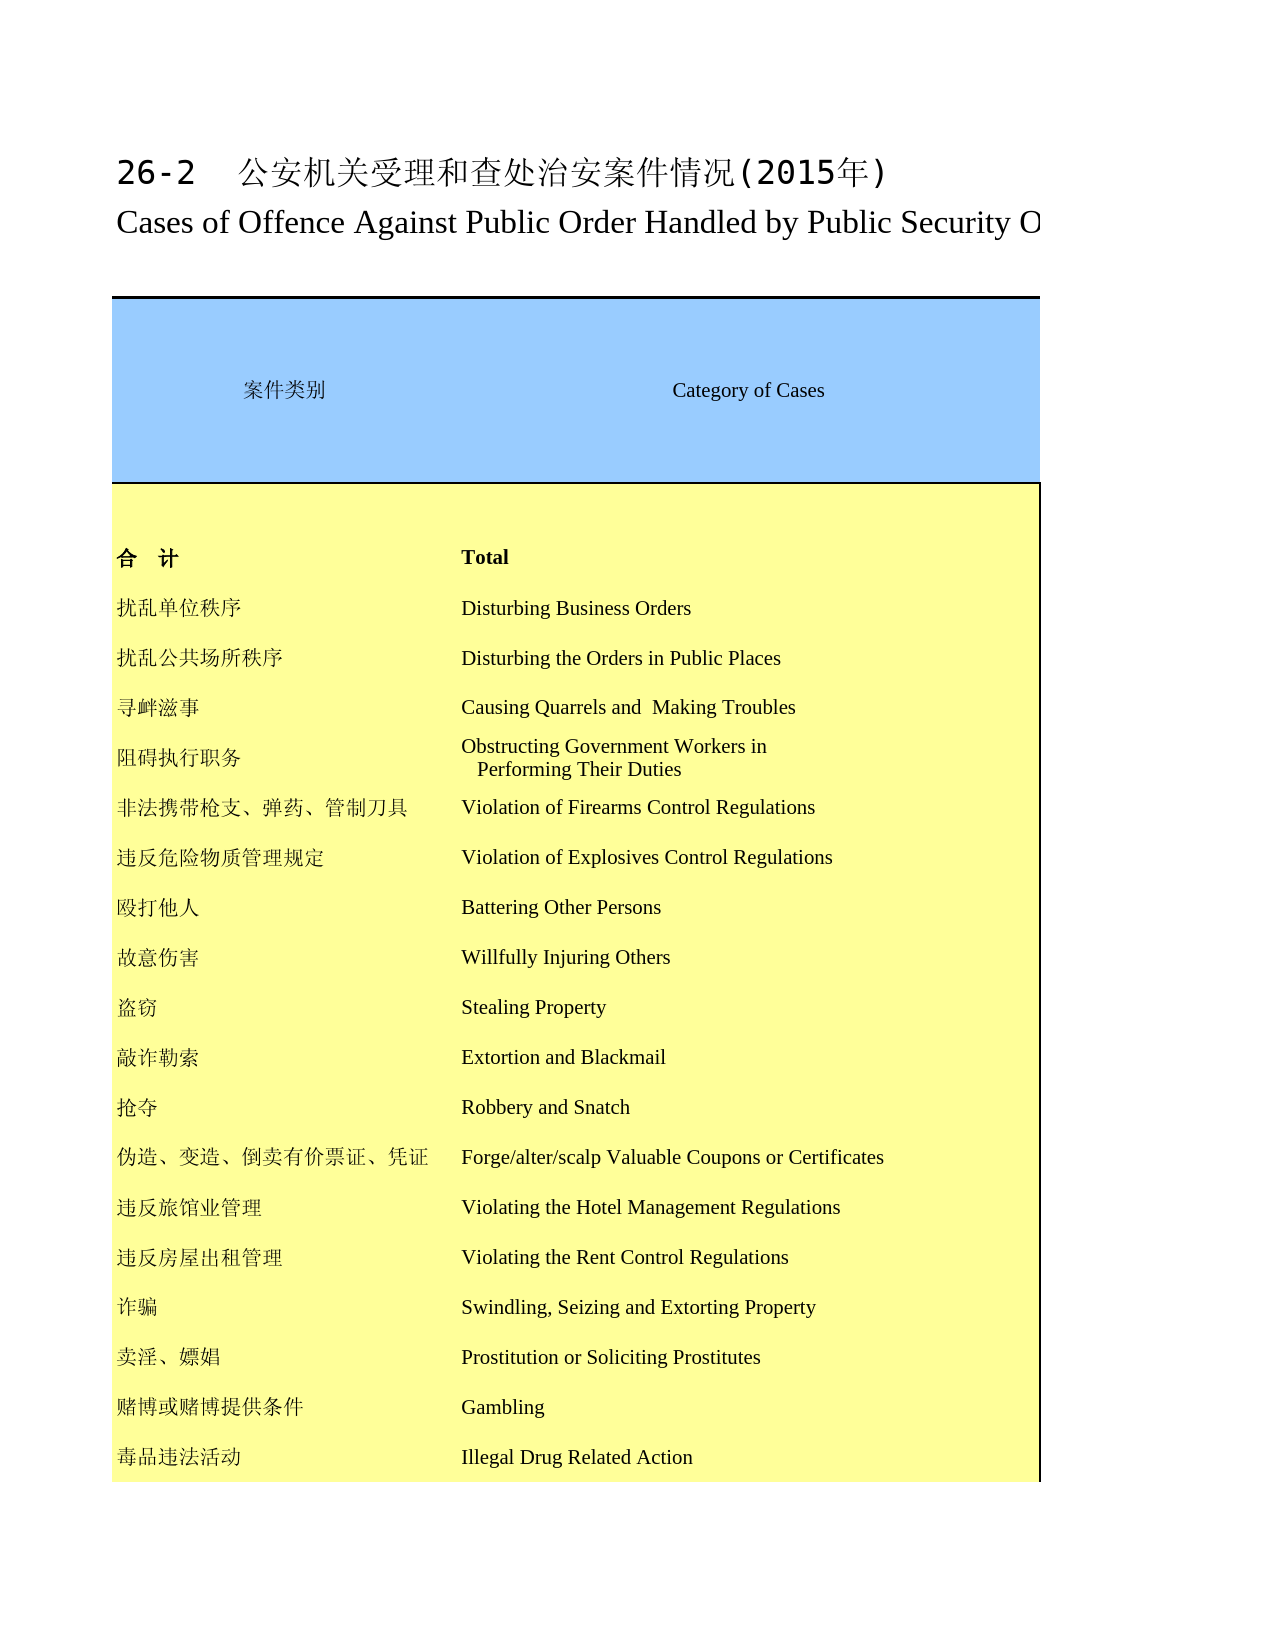 河南统计年鉴2016_ 2602114页
![[专精特新]上海新平精细化学品有限公司行业竞争力评级分析报告(2023版)](https://yunshufang001.oss-cn-shenzhen.aliyuncs.com/convert/202509/13/633989/thumb-P1-8b2cf305-38af-4176-aac4-8478d028156f-320x453.webp) [专精特新]上海新平精细化学品有限公司行业竞争力评级分析报告(2023版)8112页
[专精特新]上海新平精细化学品有限公司行业竞争力评级分析报告(2023版)8112页 《特色田园乡村建设指南》836页
![[小区点评]麓湖路3号大院(越秀区)住宅小区居住环境竞争力评级及房价趋势分析报告(2024版)](https://yunshufang001.oss-cn-shenzhen.aliyuncs.com/convert/202505/27/670991/thumb-P1-1e538d71-11a4-48be-b182-b951c310816b-320x453.webp) [小区点评]麓湖路3号大院(越秀区)住宅小区居住环境竞争力评级及房价趋势分析报告(2024版)857页
[小区点评]麓湖路3号大院(越秀区)住宅小区居住环境竞争力评级及房价趋势分析报告(2024版)857页![[小区点评]百合山庄(龙岗区)小区居住环境竞争力评级及房价趋势分析报告(2024版)](https://yunshufang001.oss-cn-shenzhen.aliyuncs.com/convert/202505/28/679483/thumb-P1-64e2c313-39e4-42a4-b577-1efb00d82e09-320x453.webp) [小区点评]百合山庄(龙岗区)小区居住环境竞争力评级及房价趋势分析报告(2024版)859页
[小区点评]百合山庄(龙岗区)小区居住环境竞争力评级及房价趋势分析报告(2024版)859页![[小区点评]东方明珠城(龙岗区)小区居住环境竞争力评级及房价趋势分析报告(2024版)](https://yunshufang001.oss-cn-shenzhen.aliyuncs.com/convert/202505/28/681400/thumb-P1-7f09a123-caf6-42ee-8e91-cce7a101d4c7-320x453.webp) [小区点评]东方明珠城(龙岗区)小区居住环境竞争力评级及房价趋势分析报告(2024版)859页
[小区点评]东方明珠城(龙岗区)小区居住环境竞争力评级及房价趋势分析报告(2024版)859页![[小区点评]安亭中央公园(公寓住宅)(上海嘉定)小区居住环境竞争力评级及房价趋势分析报告(2024版)](https://yunshufang001.oss-cn-shenzhen.aliyuncs.com/convert/202505/29/718371/thumb-P1-58d22179-470a-425d-8267-9244fb675378-320x453.webp) [小区点评]安亭中央公园(公寓住宅)(上海嘉定)小区居住环境竞争力评级及房价趋势分析报告(2024版)1330335页
[小区点评]安亭中央公园(公寓住宅)(上海嘉定)小区居住环境竞争力评级及房价趋势分析报告(2024版)1330335页![[小区点评]彩电宿舍(北京海淀)小区居住环境竞争力评级及房价趋势分析报告(2024版)](https://yunshufang001.oss-cn-shenzhen.aliyuncs.com/convert/202508/21/743782/thumb-P1-fd567665-baa0-475a-a568-3e957c84efda-320x453.webp) [小区点评]彩电宿舍(北京海淀)小区居住环境竞争力评级及房价趋势分析报告(2024版)66257页
[小区点评]彩电宿舍(北京海淀)小区居住环境竞争力评级及房价趋势分析报告(2024版)66257页![[小区点评]中旅国际公馆(一期)(福田区)小区居住环境竞争力评级及房价趋势分析报告(2024版)](https://yunshufang001.oss-cn-shenzhen.aliyuncs.com/convert/202505/28/678791/thumb-P1-f13d2f31-eec0-4128-99a5-2c06341846b7-320x453.webp) [小区点评]中旅国际公馆(一期)(福田区)小区居住环境竞争力评级及房价趋势分析报告(2024版)1860页
[小区点评]中旅国际公馆(一期)(福田区)小区居住环境竞争力评级及房价趋势分析报告(2024版)1860页![[小区点评]江南水乡(温州市瑞安市)小区居住环境竞争力评级及房价趋势分析报告(2024版)](https://yunshufang001.oss-cn-shenzhen.aliyuncs.com/convert/202502/21/774729/thumb-P1-36fe475d-af8a-44cf-861e-e34aee034fc5-320x453.webp) [小区点评]江南水乡(温州市瑞安市)小区居住环境竞争力评级及房价趋势分析报告(2024版)7163页
[小区点评]江南水乡(温州市瑞安市)小区居住环境竞争力评级及房价趋势分析报告(2024版)7163页![[小区点评]首开熙悦山澜庭(北京房山)小区居住环境竞争力评级及房价趋势分析报告(2024版)](https://yunshufang001.oss-cn-shenzhen.aliyuncs.com/convert/202508/21/746761/thumb-P1-722d5750-8202-429b-9d38-ee5b554e4236-320x453.webp) [小区点评]首开熙悦山澜庭(北京房山)小区居住环境竞争力评级及房价趋势分析报告(2024版)11958页
[小区点评]首开熙悦山澜庭(北京房山)小区居住环境竞争力评级及房价趋势分析报告(2024版)11958页 走向共同富裕的解决相对贫困思路研究_檀学文30317页
 GB_T 25499-2010 城市污水再生利用 绿地灌溉水质379页
 IPO招股书_ 诺诚健华IPO:诺诚健华首次公开发行股票并上市招股说明书51393页
 云南经济普查年鉴2013_ C-D2-B-08-1501页
![[推荐国标] GB_T 15555.12-1995 固体废物 腐蚀性测定 玻璃电极法](https://yunshufang001.oss-cn-shenzhen.aliyuncs.com/202305/28/201617/P1-aea9b913-a8a3-458c-ad83-08bb04d8b1a2.png) [推荐国标] GB_T 15555.12-1995 固体废物 腐蚀性测定 玻璃电极法174页
[推荐国标] GB_T 15555.12-1995 固体废物 腐蚀性测定 玻璃电极法174页![[专精特新]保山恒丰纺织科技有限公司行业竞争力评级分析报告(2023版)](https://yunshufang001.oss-cn-shenzhen.aliyuncs.com/convert/202506/14/652179/thumb-P1-dbc376c9-8756-467a-939d-798b0894c83d-320x453.webp) [专精特新]保山恒丰纺织科技有限公司行业竞争力评级分析报告(2023版)9126页[小区点评]胜古南里(北京朝阳)小区居住环境竞争力评级及房价趋势分析报告(2024版)8658页
[专精特新]保山恒丰纺织科技有限公司行业竞争力评级分析报告(2023版)9126页[小区点评]胜古南里(北京朝阳)小区居住环境竞争力评级及房价趋势分析报告(2024版)8658页