单位:元(yuan)行业Sector城镇全部单位国有经济单位城镇集体单位其他经济单位城镇私营单位AlltheUnitsStateOwnedUrbanCollectiveOtherUnitsUrbanPrivateInUrbanAreaUnitsOwnedUnitsUnits总计Total6466191665555607615743536农、林、牧、渔业Farming,Forest,Herd,Fishery3585936770415384165634844采矿业MiningandQuarrying5693845100395659121143497制造业...

NumberofRegisteredUnemployedPersonsandUnemploymentRateinUrbanArea年份年末城镇登记失业人数TheNumberofUnemployeedinYearEndUnemploymentYearUrbanAreasbytheEndofYearregisteredRate%197820.034.19198015.542.97199012.661.72199114.201.88199216.892.17199317.962.20199421.062.90199524.453.10199628.253.50199729.833.50199831.333.30199933.103.3...

行业Sector城镇全部单位国有经济单位城镇集体单位其他经济单位AlltheUnitsInStateOwnedUrbanCollectiveUrbanPrivateUrbanAreaUnitsOwnedUnitsUnits总计Total2327722977833360771313812农、林、牧、渔业Farming,Forest,Herd,Fishery30029.0029456.0083490采矿业MiningandQuarrying10599.0085.0013910375制造业Manufacturing483256.009398.005146468712电力...

单位:人(person)行业Sector城镇全部单位国有经济单位城镇集体单位其他经济单位城镇私营单位AlltheUnitsStateOwnedUrbanCollectiveOtherUnitsUrbanPrivateInUrbanAreaUnitsOwnedUnitsUnits总计Total10891623221508910603437054334865067农、林、牧、渔业Farming,Forest,Herd,Fishery15292873516291178877333采矿业MiningandQuarrying127559265750343579218...

TotalEmployedPersonsfortheWholeSociety单位:万人(10000person)年份合计城镇乡村第一产业第二产业第三产业YearTotalUrbanRuralPrimaryIndustrySecondaryIndustryTertiaryIndustry19521020.30141.60878.7019651404.20222.701181.6019701618.50278.001340.8019751802.50381.701420.8019781910.40458.001452.301470.60269.00170.8019801986.90507.201479.70...

(10000persons)地区Regions户籍人口常住人口地区Regions户籍人口常住人口TotalPermnantTotalPermnantPopulationPopulationPopulationPopulation荆门市Jingmen290.95289.75蕲春县Hanchun100.7578.22东宝区Dongbao35.4637.91黄梅县Huangmei103.1786.94掇刀区Zhuodao29.6333.59麻城市Macheng115.3988.04京山市Jingshan62.6362.17武穴市Wuxue82.3265.40沙洋县S...

单位:人(person)行业Sector城镇全部单位国有经济单位城镇集体单位其他经济单位城镇私营单位AlltheUnitsStateOwnedUrbanCollectiveOtherUnitsUrbanPrivateInUrbanAreaUnitsOwnedUnitsUnits总计Total11402632237260911249440524624865067农、林、牧、渔业Farming,Forest,Herd,ishery16732387670301201977333采矿业MiningandQuarrying1323952917533916492187...

PopulationofCities,PrefecturesandCounties(10000persons)地区Region地区Region全省Province6177.845927.00丹江口市Danjiangkou46.2544.54武汉市Wuhan906.401121.20宜昌市Yichang390.94413.79江岸区Jiang'an78.5996.28西陵区Xiling39.9455.06江汉区Jianghan51.3672.98伍家岗区Wujiagang19.7025.18硚口区Qiaokou53.9986.89点军区Dianjun10.4011.25汉阳区Ha...

CompositionofUrbanandRuralPopulation单位:万人(10000persons)年份总人口YearTotalPopulation19522745.00271.412416.1719573062.41411.692650.7219653504.54485.063019.4819754408.15626.223781.9319804684.45786.493897.9619854980.811464.653516.1619865047.831187.233860.6019875120.271288.613831.6619885184.941389.993794.9519895258.831491.37376...
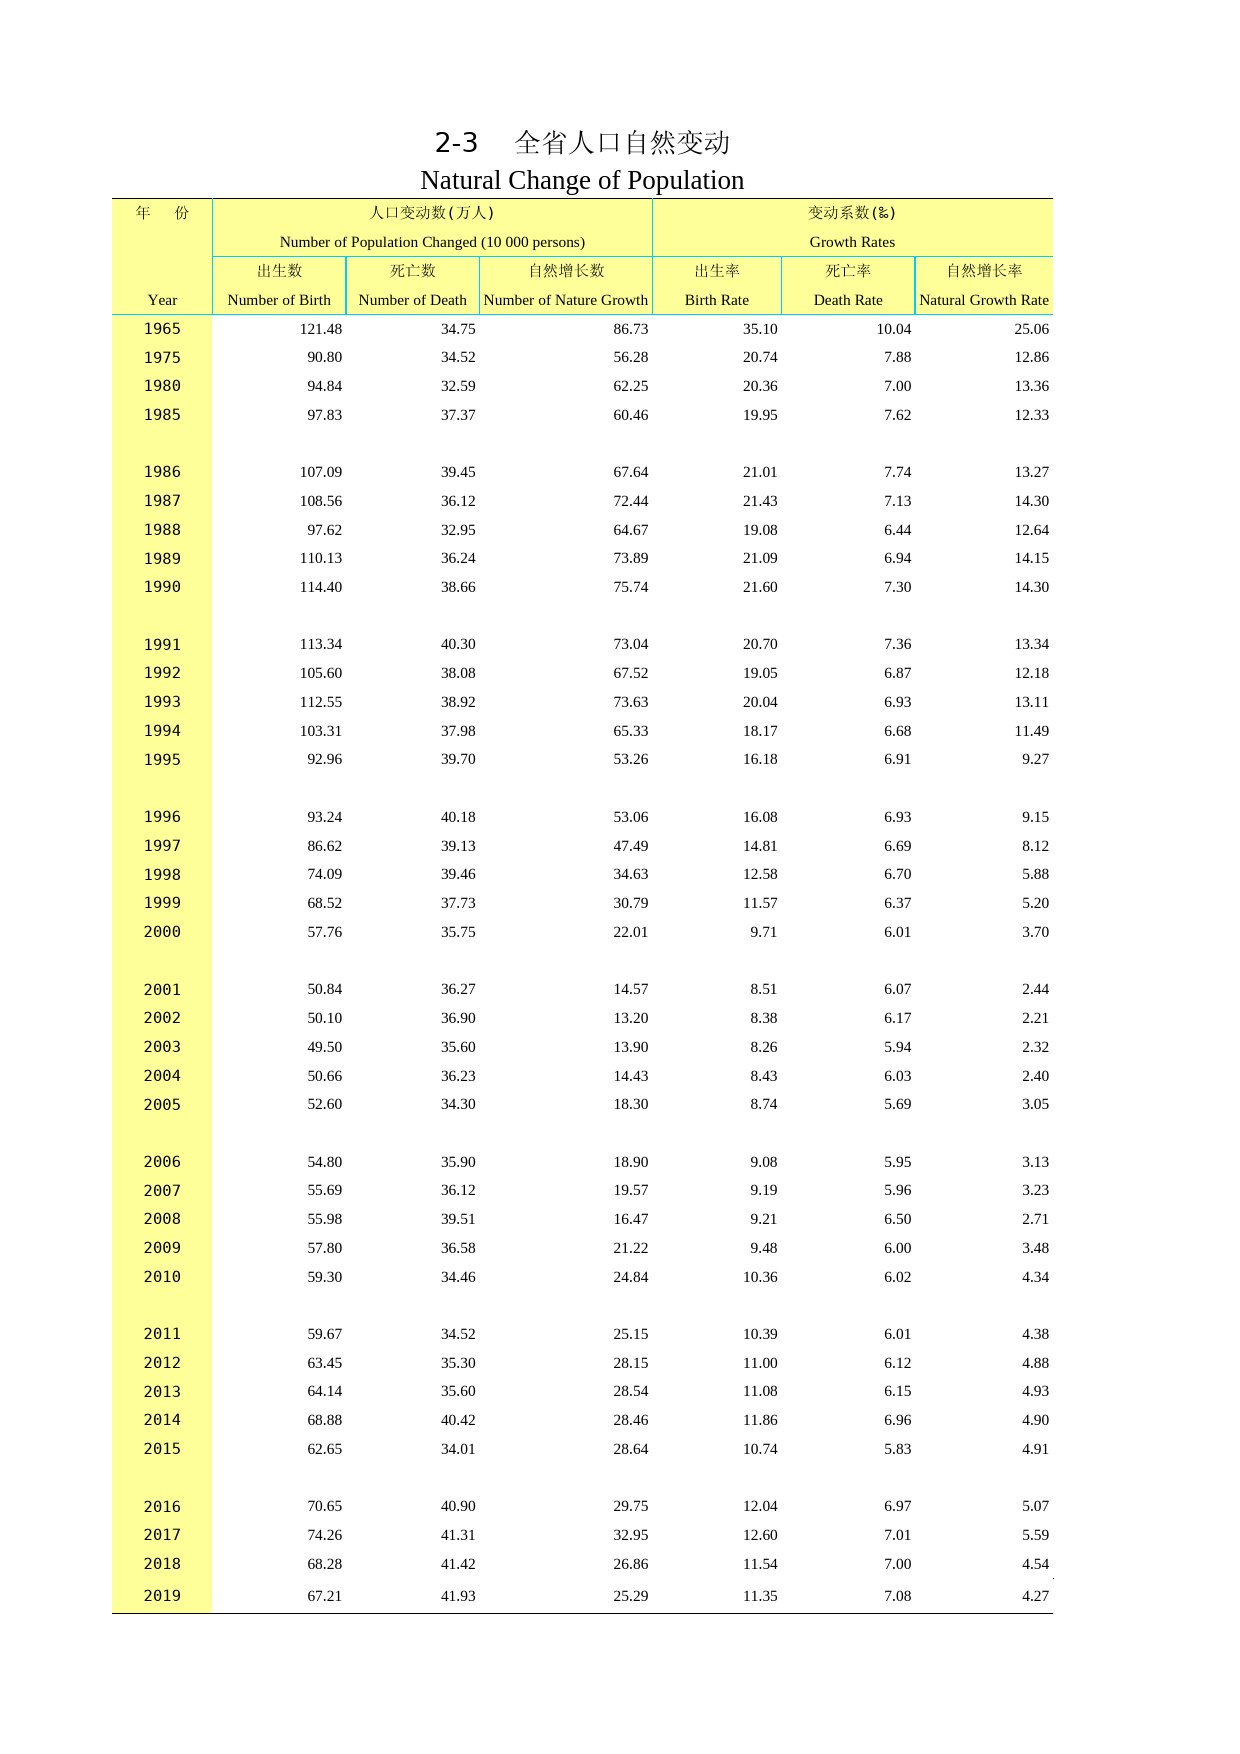
NaturalChangeofPopulation年份NumberofPopulationChanged(10000persons)GrowthRates出生数死亡数自然增长数出生率死亡率自然增长率YearNumberofBirthNumberofDeathNumberofNatureGrowthBirthRateDeathRateNaturalGrowthRate1965121.4834.7586.7335.1010.0425.06197590.8034.5256.2820.747.8812.86198094.8432.5962.2520.367.0013.36198597.8337.3760.4619...

Population单位:万人(10000persons)年份户籍人口常住人口YearTotalPopulationTotalPopulation19522745.01414.61330.419573062.41579.71482.719653504.51793.31711.219754408.22261.72146.519804684.52401.82282.719854931.02540.02391.04980.82566.32414.519864989.02573.42415.65047.82603.32444.519875058.12608.72449.45120.32640.32480.019885144.226...

IndicesofGrossDomesticProductofCitiesandPrefectures(2019)(precedingyear=100,%)地区Regions地区生产总值第一产业第二产业第三产业GrossDomesticProductPrimaryIndustrySecondaryIndustryTertiaryIndustry武汉Wuhan107.4103.0106.5108.2黄石Huangshi108.2103.4108.9108.1十堰Shiyan107.0103.5106.3108.5宜昌Yichang108.1103.3109.6107.5襄阳Xiangyang10...
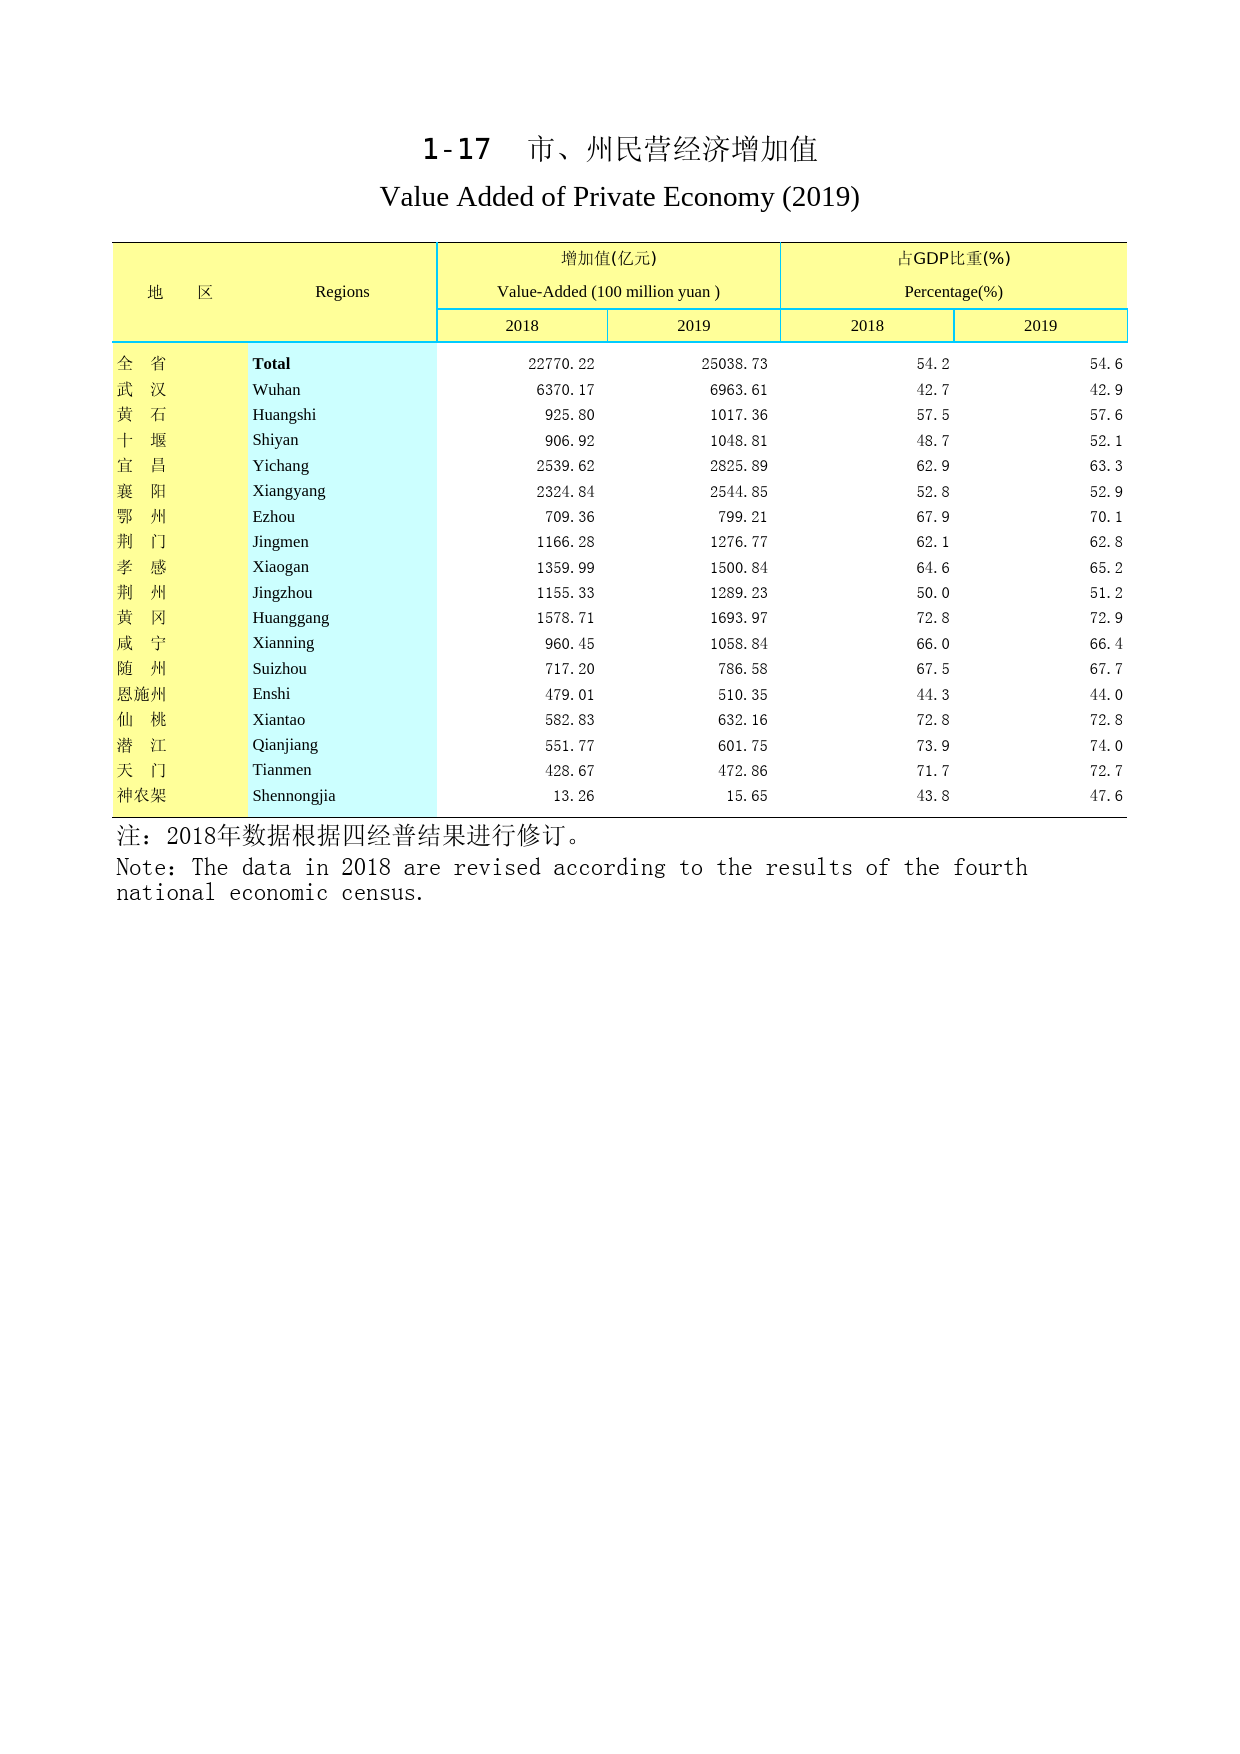
ValueAddedofPrivateEconomy(2019)地区RegionsValue-Added(100millionyuan)Percentage(%)2018201920182019全省Total22770.2225038.7354.254.6武汉Wuhan6370.176963.6142.742.9黄石Huangshi925.801017.3657.557.6十堰Shiyan906.921048.8148.752.1宜昌Yichang2539.622825.8962.963.3襄阳Xiangyang2324.842544.8552.852.9鄂州Ezhou709.36799.2167.970.1荆门Ji...

ContributionoftheThreeStrataofIndustrytoGDPGrowth单位:百分点(percentagepoint)年份地区生产总值第一产业第二产业第三产业YearGrossDomesticProductPrimaryIndustrySecondIndustryIndustryTertiaryIndustry199214.12.56.86.54.8199313.01.76.76.04.6199413.72.07.97.33.8199513.22.37.16.43.8199611.61.17.16.43.4199711.91.66.25.74.119988.6-0.15.24...

CompositionofGrossDomesticProduct年份第一产业第二产业第三产业工业建筑业YearTotalOutputPrimarySecondaryIndustryContructionTertiaryBankingRealEstate(%)IndustryIndustryIndustry195210056.715.612.92.727.7195510053.321.818.43.524.9195710049.823.718.55.226.5196210056.220.317.52.923.5196510052.129.124.05.218.8197010050.430.424.75.819.21...

GrossDomesticProductofCitiesandPrefectures(2019)(100millionyuan)地区Regions地区生产总值第一产业第二产业第三产业GrossDomesticProductPrimaryIndustrySecondaryIndustryTertiaryIndustry武汉Wuhan16223.21378.995988.889855.34黄石Huangshi1767.19103.82900.38762.99十堰Shiyan2012.72171.46884.18957.08宜昌Yichang4460.82416.052054.151990.62襄阳...
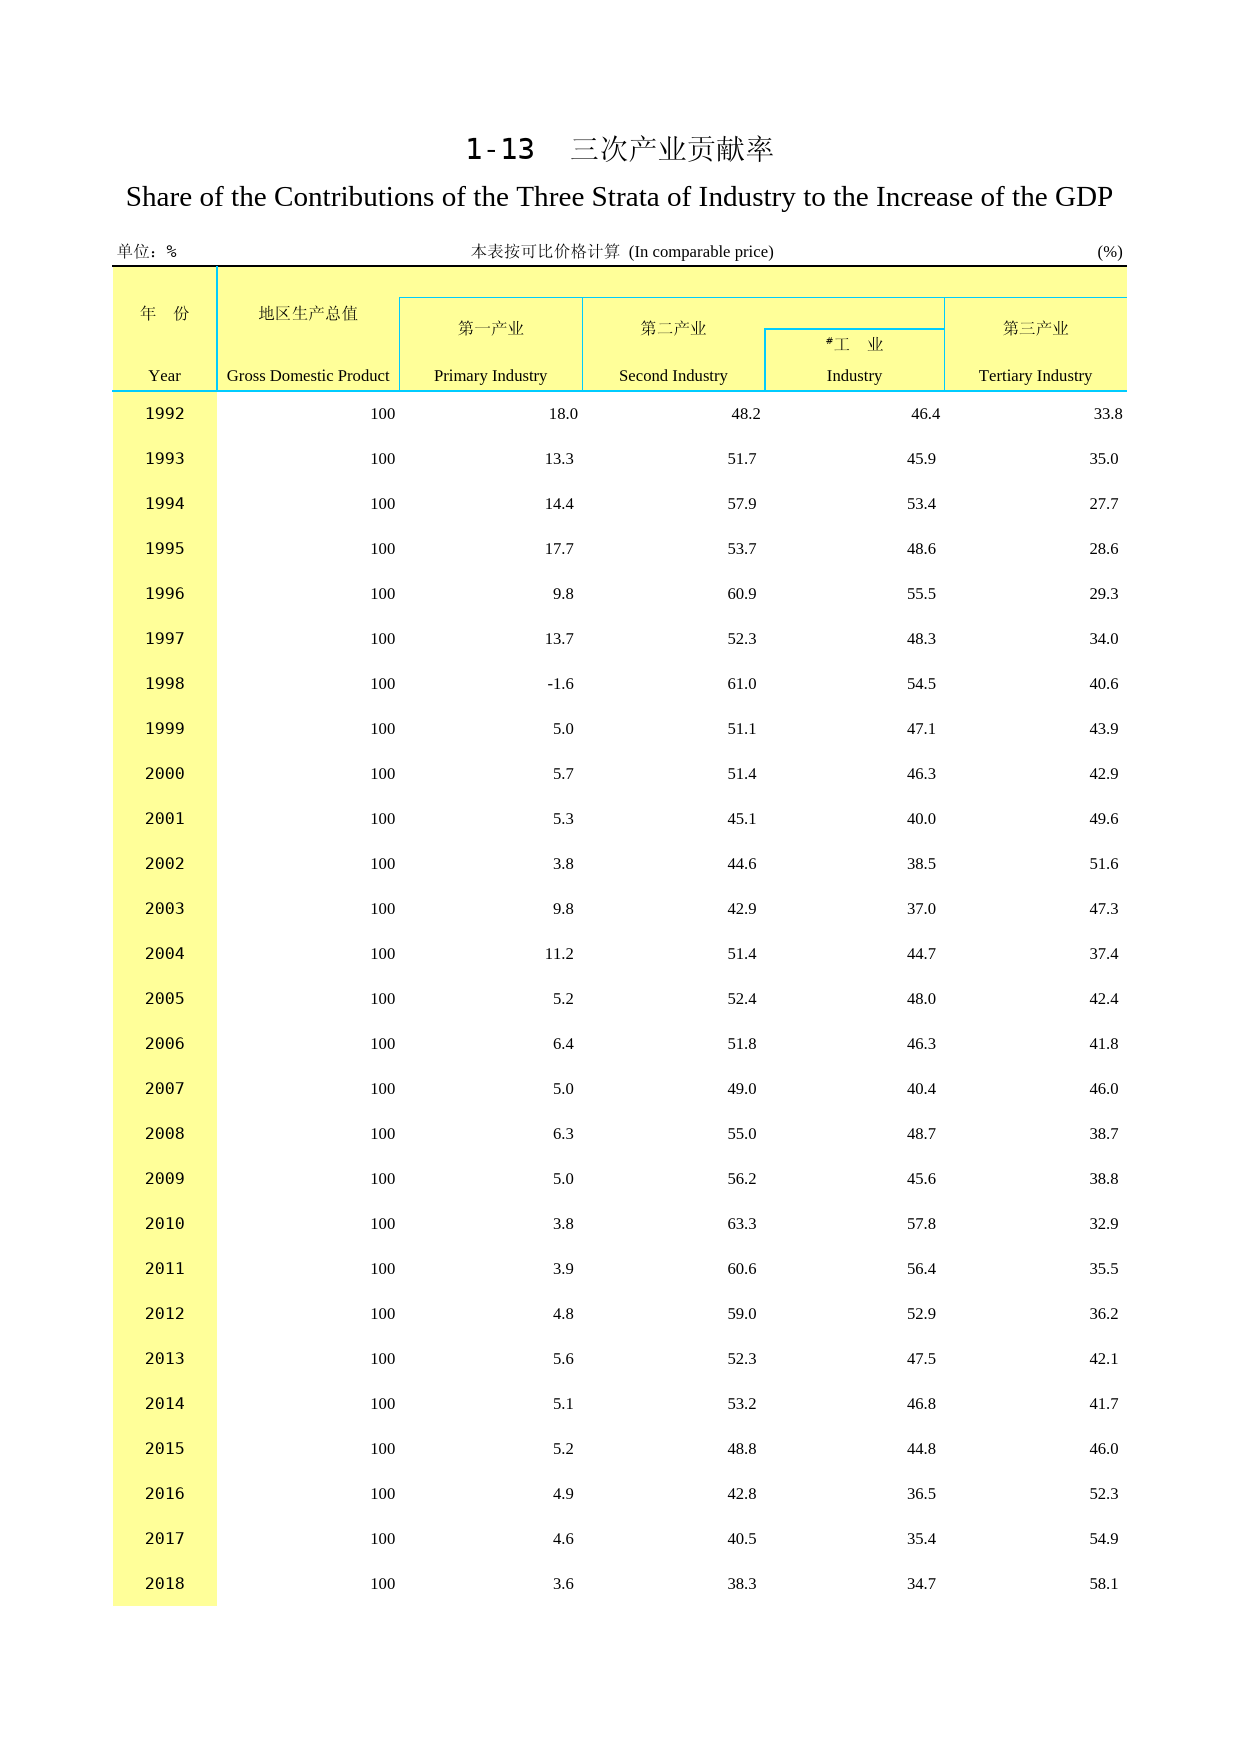
ShareoftheContributionsoftheThreeStrataofIndustrytotheIncreaseoftheGDP(%)年份地区生产总值第一产业第二产业第三产业YearGrossDomesticProductPrimaryIndustrySecondIndustryIndustryTertiaryIndustry199210018.048.246.433.8199310013.351.745.935.0199410014.457.953.427.7199510017.753.748.628.619961009.860.955.529.3199710013.752.348.334.0199...

GrossDomesticProduct年份地区生产总值第一产业第二产业第三产业工业建筑业YearTotalOutput(100PrimarySecondaryIndustryContructionTertiaryBankingRealEstatemillionyuan)IndustryIndustryIndustry195224.5113.903.823.170.666.79195534.0518.147.436.251.208.48195748.8624.3311.569.032.5612.97196252.1329.3010.609.101.5312.23196572.4337.7421.1017...

IndicesofGrossDomesticProduct(precedingyear=100)人均地区年份第一产业第二产业第三产业生产总值工业建筑业(%)YearTotalOutputPrimarySecondaryTertiaryPerCapita(%)IndustryIndustryIndustryContructionIndustryBankingRealEstateGDP(%)1953114.0107.4129.4141.093.3122.7111.61955127.1135.5104.9100.2139.2127.1124.81957107.4106.4115.3109.5146.010...

IndicesofGrossDomesticProduct(yearof1952=100)年份人均地区第一产业第二产业第三产业生产总值工业建筑业(%)YearTotalOutputPrimarySecondaryTertiaryPerCapita(%)IndustryIndustryIndustryContructionIndustryBankingRealEstateGDP(%)1953114.0107.4129.4141.093.3122.7111.61955121.6115.7152.3168.4102.2118.2114.41957169.5143.7280.1295.2233.2172.0...
![[城市房价]北京市房价趋势分析报告(2025年4月版)-西城区](https://yunshufang001.oss-cn-shenzhen.aliyuncs.com/convert/202505/23/798767/thumb-P1-0950daa9-da49-415b-8cb6-8e3e8d0406f1-320x453.webp) [城市房价]北京市房价趋势分析报告(2025年4月版)-西城区11927页
[城市房价]北京市房价趋势分析报告(2025年4月版)-西城区11927页![[小区点评]胜古南里(北京朝阳)小区居住环境竞争力评级及房价趋势分析报告(2024版)](https://yunshufang001.oss-cn-shenzhen.aliyuncs.com/convert/202508/21/743778/thumb-P1-65381ca8-000b-4af7-98ba-9bb502def2f7-320x453.webp) [小区点评]胜古南里(北京朝阳)小区居住环境竞争力评级及房价趋势分析报告(2024版)8658页
[小区点评]胜古南里(北京朝阳)小区居住环境竞争力评级及房价趋势分析报告(2024版)8658页 河南统计年鉴2016_ 2602114页
![[专精特新]上海新平精细化学品有限公司行业竞争力评级分析报告(2023版)](https://yunshufang001.oss-cn-shenzhen.aliyuncs.com/convert/202509/13/633989/thumb-P1-8b2cf305-38af-4176-aac4-8478d028156f-320x453.webp) [专精特新]上海新平精细化学品有限公司行业竞争力评级分析报告(2023版)8112页
[专精特新]上海新平精细化学品有限公司行业竞争力评级分析报告(2023版)8112页 《特色田园乡村建设指南》836页
![[小区点评]麓湖路3号大院(越秀区)住宅小区居住环境竞争力评级及房价趋势分析报告(2024版)](https://yunshufang001.oss-cn-shenzhen.aliyuncs.com/convert/202505/27/670991/thumb-P1-1e538d71-11a4-48be-b182-b951c310816b-320x453.webp) [小区点评]麓湖路3号大院(越秀区)住宅小区居住环境竞争力评级及房价趋势分析报告(2024版)857页
[小区点评]麓湖路3号大院(越秀区)住宅小区居住环境竞争力评级及房价趋势分析报告(2024版)857页![[小区点评]百合山庄(龙岗区)小区居住环境竞争力评级及房价趋势分析报告(2024版)](https://yunshufang001.oss-cn-shenzhen.aliyuncs.com/convert/202505/28/679483/thumb-P1-64e2c313-39e4-42a4-b577-1efb00d82e09-320x453.webp) [小区点评]百合山庄(龙岗区)小区居住环境竞争力评级及房价趋势分析报告(2024版)859页
[小区点评]百合山庄(龙岗区)小区居住环境竞争力评级及房价趋势分析报告(2024版)859页![[小区点评]东方明珠城(龙岗区)小区居住环境竞争力评级及房价趋势分析报告(2024版)](https://yunshufang001.oss-cn-shenzhen.aliyuncs.com/convert/202505/28/681400/thumb-P1-7f09a123-caf6-42ee-8e91-cce7a101d4c7-320x453.webp) [小区点评]东方明珠城(龙岗区)小区居住环境竞争力评级及房价趋势分析报告(2024版)859页
[小区点评]东方明珠城(龙岗区)小区居住环境竞争力评级及房价趋势分析报告(2024版)859页![[小区点评]安亭中央公园(公寓住宅)(上海嘉定)小区居住环境竞争力评级及房价趋势分析报告(2024版)](https://yunshufang001.oss-cn-shenzhen.aliyuncs.com/convert/202505/29/718371/thumb-P1-58d22179-470a-425d-8267-9244fb675378-320x453.webp) [小区点评]安亭中央公园(公寓住宅)(上海嘉定)小区居住环境竞争力评级及房价趋势分析报告(2024版)1330335页
[小区点评]安亭中央公园(公寓住宅)(上海嘉定)小区居住环境竞争力评级及房价趋势分析报告(2024版)1330335页![[小区点评]彩电宿舍(北京海淀)小区居住环境竞争力评级及房价趋势分析报告(2024版)](https://yunshufang001.oss-cn-shenzhen.aliyuncs.com/convert/202508/21/743782/thumb-P1-fd567665-baa0-475a-a568-3e957c84efda-320x453.webp) [小区点评]彩电宿舍(北京海淀)小区居住环境竞争力评级及房价趋势分析报告(2024版)66257页
[小区点评]彩电宿舍(北京海淀)小区居住环境竞争力评级及房价趋势分析报告(2024版)66257页![[小区点评]中旅国际公馆(一期)(福田区)小区居住环境竞争力评级及房价趋势分析报告(2024版)](https://yunshufang001.oss-cn-shenzhen.aliyuncs.com/convert/202505/28/678791/thumb-P1-f13d2f31-eec0-4128-99a5-2c06341846b7-320x453.webp) [小区点评]中旅国际公馆(一期)(福田区)小区居住环境竞争力评级及房价趋势分析报告(2024版)1860页
[小区点评]中旅国际公馆(一期)(福田区)小区居住环境竞争力评级及房价趋势分析报告(2024版)1860页![[小区点评]江南水乡(温州市瑞安市)小区居住环境竞争力评级及房价趋势分析报告(2024版)](https://yunshufang001.oss-cn-shenzhen.aliyuncs.com/convert/202502/21/774729/thumb-P1-36fe475d-af8a-44cf-861e-e34aee034fc5-320x453.webp) [小区点评]江南水乡(温州市瑞安市)小区居住环境竞争力评级及房价趋势分析报告(2024版)7163页
[小区点评]江南水乡(温州市瑞安市)小区居住环境竞争力评级及房价趋势分析报告(2024版)7163页![[推荐国标] GB_T 10781.2-2022 白酒质量要求 第2部分:清香型白酒](https://yunshufang001.oss-cn-shenzhen.aliyuncs.com/202305/29/203985/P1-8f6cc700-cd5f-428c-90a8-58084704d8fe.png) [推荐国标] GB_T 10781.2-2022 白酒质量要求 第2部分:清香型白酒8378页
[推荐国标] GB_T 10781.2-2022 白酒质量要求 第2部分:清香型白酒8378页 10元收款码(仅用于相关项目收款使用)165871页
 GB+1499.2-2024钢筋混凝土用钢 第2部分:热轧带肋钢筋6723页
![[小区点评]首开熙悦山澜庭(北京房山)小区居住环境竞争力评级及房价趋势分析报告(2024版)](https://yunshufang001.oss-cn-shenzhen.aliyuncs.com/convert/202508/21/746761/thumb-P1-722d5750-8202-429b-9d38-ee5b554e4236-320x453.webp) [小区点评]首开熙悦山澜庭(北京房山)小区居住环境竞争力评级及房价趋势分析报告(2024版)11958页
[小区点评]首开熙悦山澜庭(北京房山)小区居住环境竞争力评级及房价趋势分析报告(2024版)11958页 走向共同富裕的解决相对贫困思路研究_檀学文30317页
 GB_T 25499-2010 城市污水再生利用 绿地灌溉水质379页
![[推荐国标] GB_T 10781.1-2021 白酒质量要求 第1部分:浓香型白酒](https://yunshufang001.oss-cn-shenzhen.aliyuncs.com/202305/29/203842/P1-f9b77e15-9bd6-4547-a529-c7618dc50092.png) [推荐国标] GB_T 10781.1-2021 白酒质量要求 第1部分:浓香型白酒122813页
[推荐国标] GB_T 10781.1-2021 白酒质量要求 第1部分:浓香型白酒122813页 IPO招股书_ 诺诚健华IPO:诺诚健华首次公开发行股票并上市招股说明书51393页