5-1Continued(%)YearGrowthrateGrowthrateGrowthrateGrowthrateGrowthrateofTotalofInvestmentofInvestmentofInvestmentofInvestmentinUrbaninRealEstateinRuralInfrastructureinFixedAssetsFixedAssetsDevelopmentFixedAssetsInvestment1978197917.317.37.4198025.325.33.41981-198518.811.710.3198110.2-5.4-3.319825.59.9-21.25.2198332.911.6212.29.81...

5-1TOTALINVESTMENTINFIXEDASSETSANDGROWTHRATE(1978-201(1YearTotalInvestmentinInvestmentinInvestmentInfrastructureInvestmentUrbanRealEstateinRuralinFixedAssetsFixedAssetsDevelopmentFixedAssetsInvestment197822.622.65.4197926.526.55.8198033.233.26.01981-1985286.8234.450.840.6198136.631.45.25.8198238.634.54.16.1198351.338.512.86.7198...

5-2TOTALINVESTMENTINFIXEDASSETSBYREGISTRATIONTYPE(197YearTotalState-Collectively-Joint-HongKong,InvestmentownedownedstockMacaoandinFixedAssetsTaiwan197822.6197926.5198033.21981-1985286.8223.822.6198136.630.11.3198238.633.01.5198351.337.11.4198466.350.02.2198594.073.616.21986-1990724.1609.683.11986106.288.713.31987136.2115.815.21...
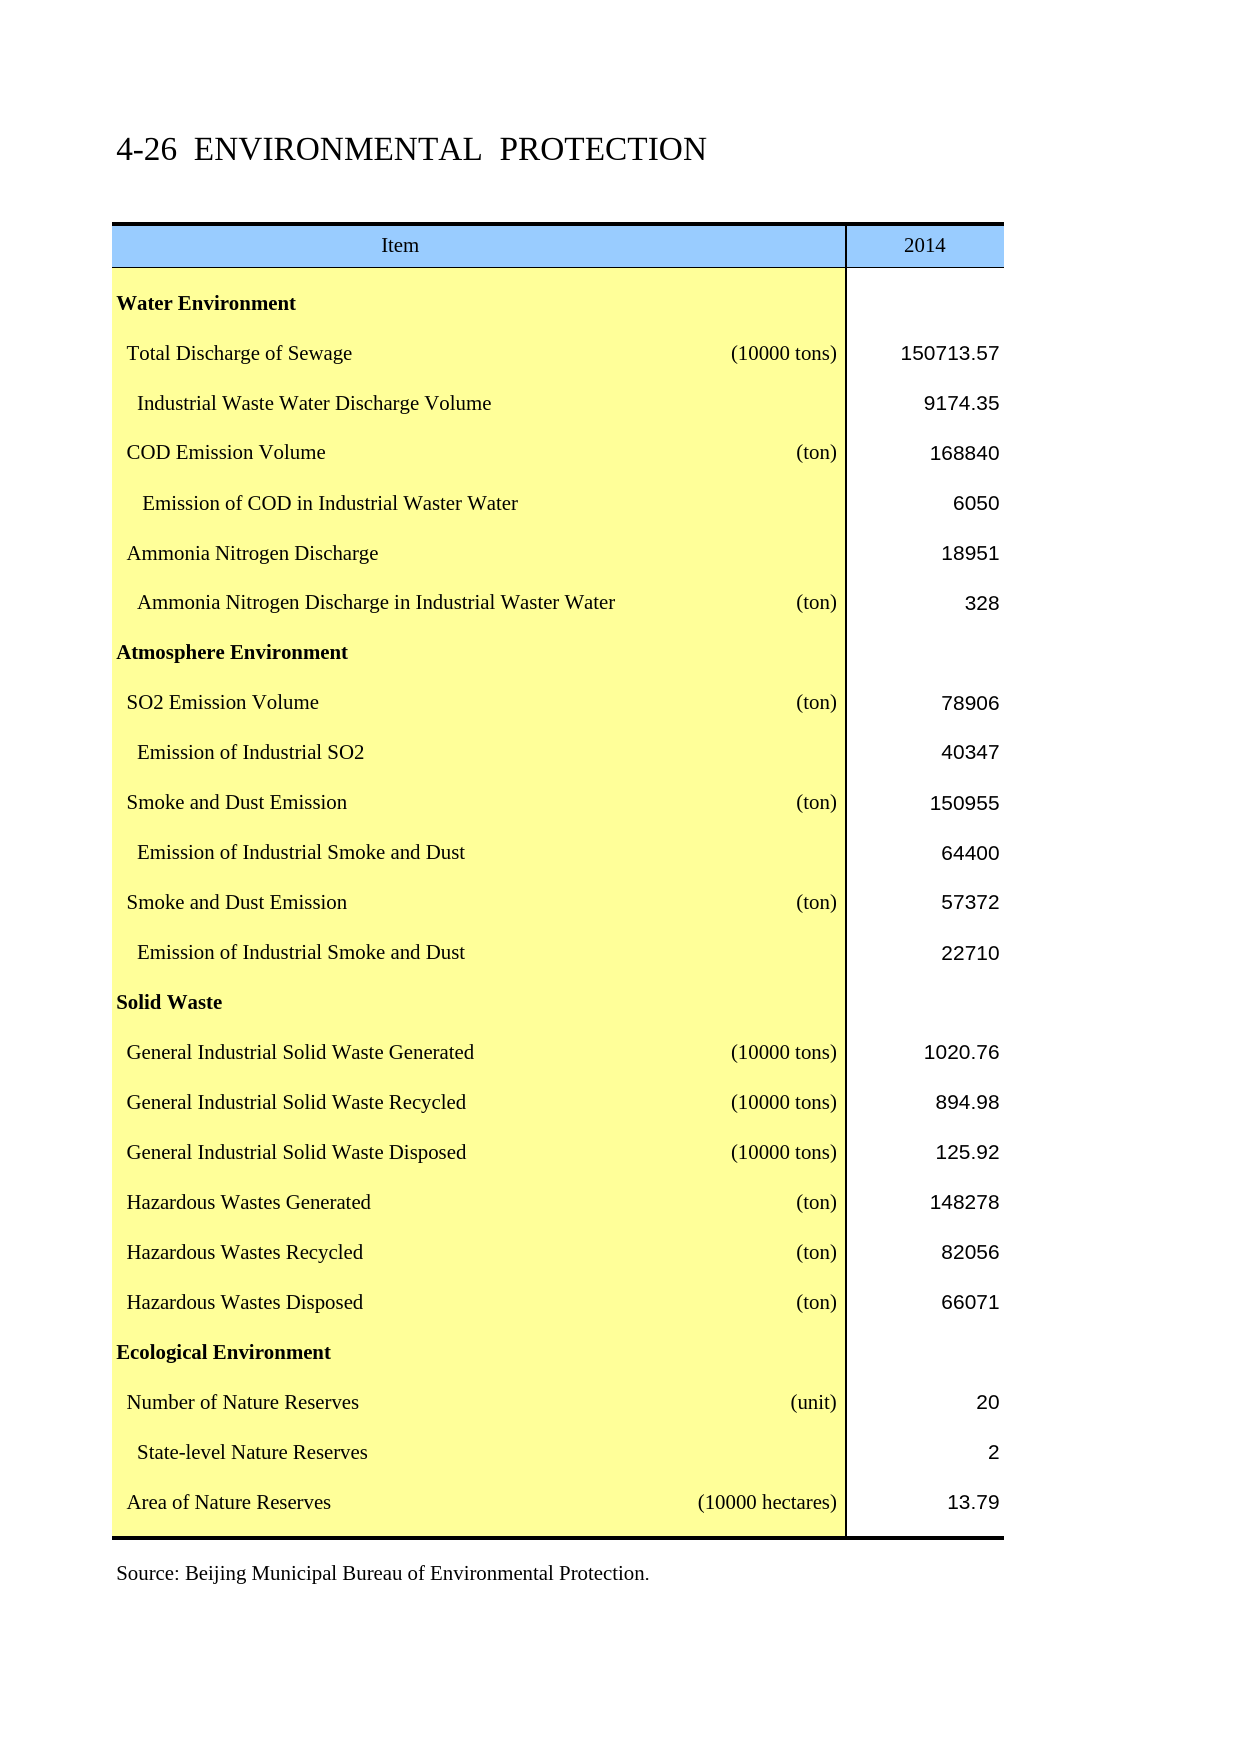
4-26ENVIRONMENTALPROTECTIONItem2014WaterEnvironmentTotalDischargeofSewage(10000tons)150713.57IndustrialWasteWaterDischargeVolume9174.35CODEmissionVolume(ton)168840EmissionofCODinIndustrialWasterWater6050AmmoniaNitrogenDischarge18951AmmoniaNitrogenDischargeinIndustrialWasterWater(ton)328AtmosphereEnvironmentSO2EmissionVolume(ton)...

4-25ENVIRONMENTALPROTECTION(2000-2014)YearDailyAverageofDailyAverageDailyCODInspiratoryofSulfurAverageofEmissionEmissionParticulateMatterDioxideNitrogenVolumeVolumeintheYearintheYearDioxide(mg/cu.m)(mg/cu.m)(mg/cu.m)(10000tons)(10000tons)20000.1620.0710.07117.922.420010.1650.0640.07117.020.120020.1660.0670.07615.319.220030.1410....
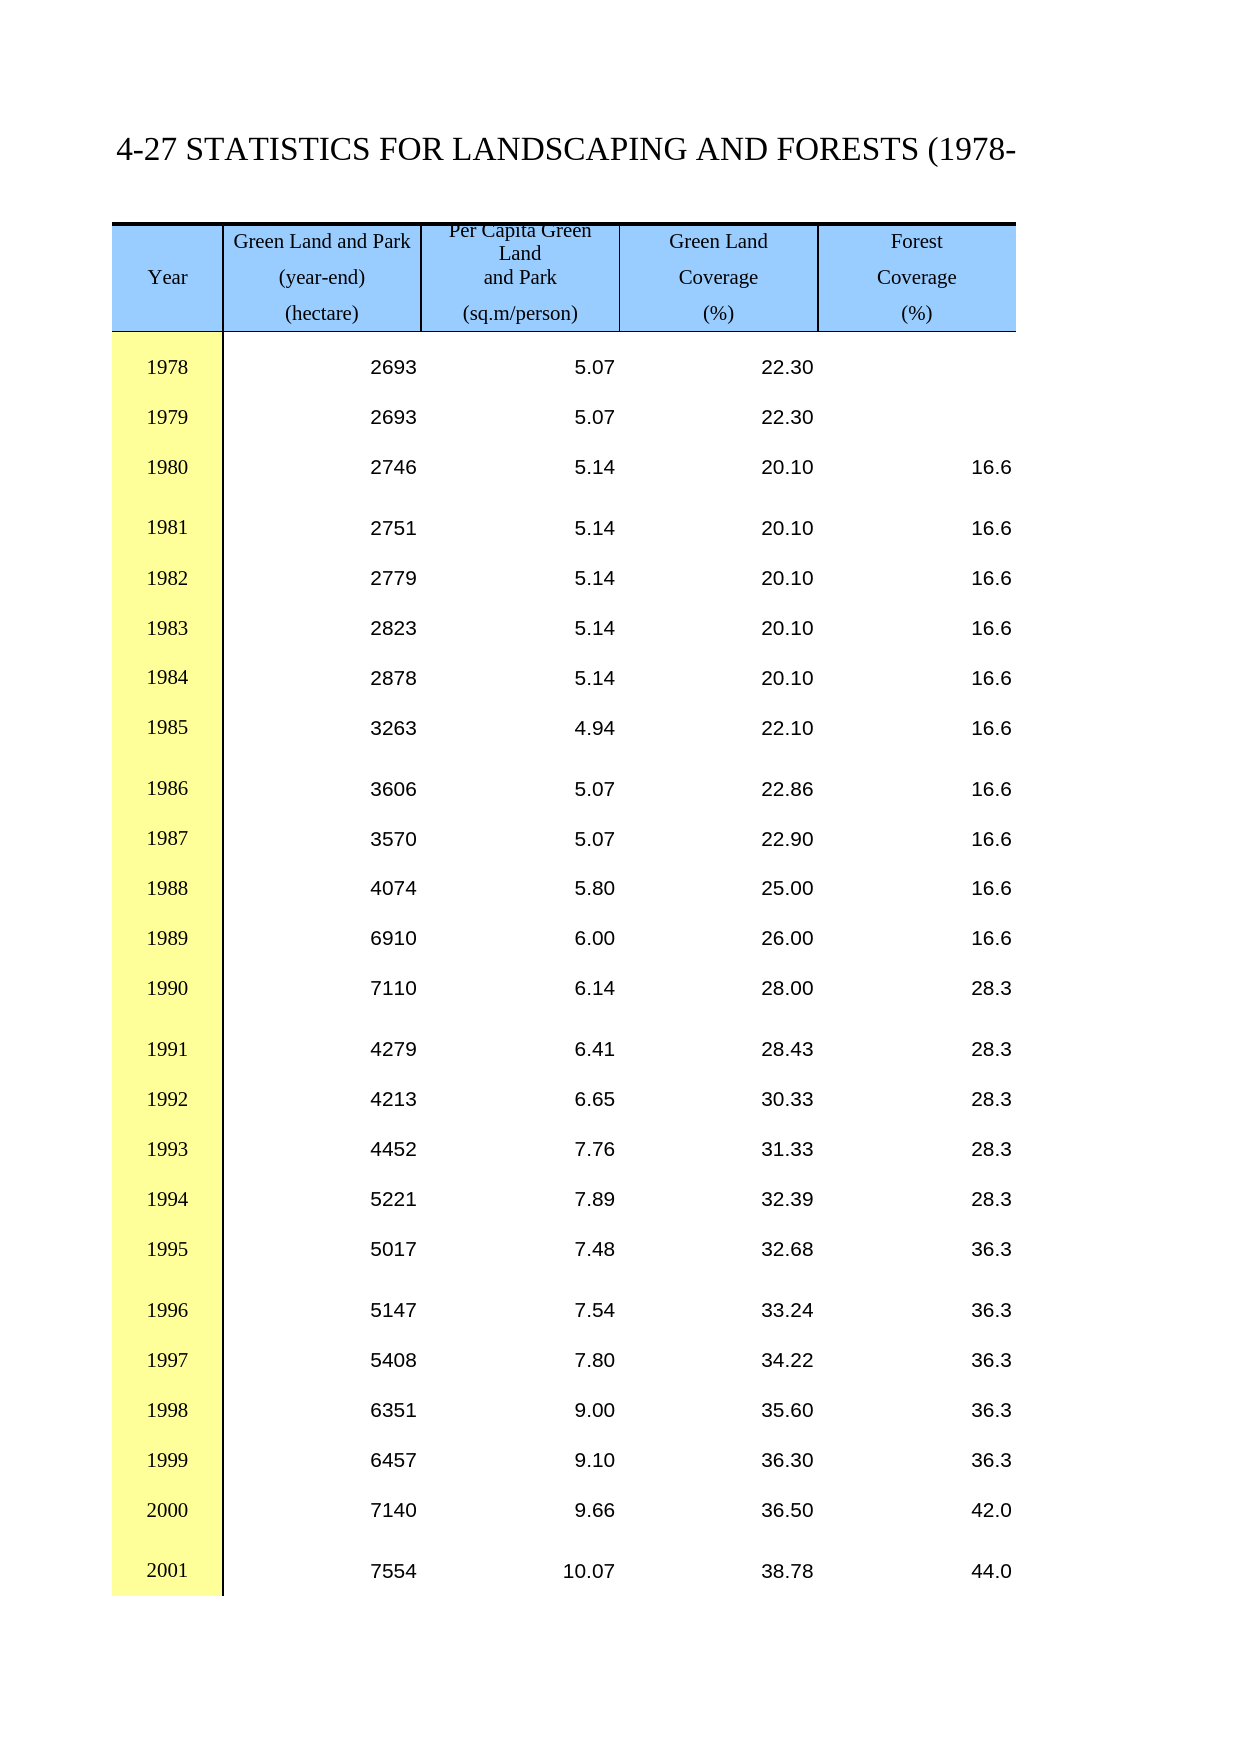
4-27STATISTICSFORLANDSCAPINGANDFORESTS(1978-2014)YearGreenLandandParkGreenLandForest(year-end)andParkCoverageCoverage(hectare)(sq.m/person)(%)(%)197826935.0722.30197926935.0722.30198027465.1420.1016.6198127515.1420.1016.6198227795.1420.1016.6198328235.1420.1016.6198428785.1420.1016.6198532634.9422.1016.6198636065.0722.8616.61987...

4-23WATERDRAINAGEANDSAVINGItem20142013WaterDrainageSewageTreatmentCapacity(10000cu.m/day)425393Grade-IIandIIITreatment(10000cu.m/day)425393AnnualTreatmentVolumeofSewage(10000cu.m)139107131401TreatedbySewageTreatmentPlants(10000cu.m)136531128745.7Grade-IIandIIITreatment(10000cu.m)136531128745.7SewageTreatmentRate(%)86.184.6Rateof...

4-24MUNICIPALENVIRONMENTANDSANITATIONItem2014WorkLoadAreaofCleanedStreets(10000sq.m/day)15104HarmlessDisposalCapacityofDomesticWaste(ton/day)21971OutputofDomesticWaste(10000tons)733.8DomesticWasteRemovedandTransported(10000tons)733.8VolumeofHarmlessDisposalofDomesticWaste(10000tons)730.8RateofHarmlessDisposalofDomesticWaste(%)99...

4-22SEWAGEDISPOSALANDENVIRONMENTALSANITATION(1978-2014YearLengthSewageSewageVolumeofHarmlessofTreatmentTreatmentRecycledDisposalSewageCapacityRateWaterCapacityofPipes(10000UsedDomesticWaste(km)cu.m/day)(%)(10000cu.m)(ton/day)1978290237.619793092310.21980334239.419813472510.819823652510.919834112510.219845682510.019857062510.0198...

4-19STATISTICSFORWATERRESOURCES(2001-2014)Item2001200220032004TotalVolumeofWaterResourceintheYear19.216.118.421.4VolumeofSurfaceWaterResource7.85.36.18.2VolumeofUndergroundWaterResource15.714.714.816.5Per-capitaWaterResource(cu.m)139.7114.7127.8145.1TotalVolumeofWaterSupplied38.934.635.834.6(Consumed)intheYearBySourceSurfaceWate...

4-17TOTALELECTRICITYCONSUMPTIONINBEIJING(1978-2014)YearElectricityConsumptionPrimarySecondaryIndustryConstructionTertiaryIndustryIndustryIndustry19787350004899357062157062194555197980231752134620262620262107437198085463865283648496648496116947198186715380027643976643976121883198292570010484265706065706013940319839562939260168793...

4-18LANDUTILIZATION(2009-2013)YearArableGardenForestGrassLandforUrban,LandPlotLandLandRural,IndustrialandMiningUse2009227170.43141617.22743696.1984843.14284791.792010223779.38139298.50742018.5085827.05290782.012011221956.16138072.99740730.8785651.69295116.722012220856.16137117.72739633.4885491.29297758.792013221157.28135573.3773...

4-16DAILYCONSUMPTIONOFMAINENERGYVARIETIES(2000-2014)YearTotal(10000tonsCoalCokeCrudeOilGasolineofSCE)(ton)(ton)(ton)(ton)200011.376598.412270.520620.23046.4200111.674331.511769.919191.83997.3200212.270726.010353.420501.44380.8200312.775274.012008.219909.64772.6200414.080404.412451.622114.85420.8200515.184081.410887.721906.86444....

4-15PERCAPITAENERGYCONSUMPTIONFORNON-PRODUCTIVEPURPOSE(2000-2014)YearTotal(kgofSCE)CoalElectricityLiquefiedPetroleum(kg)(kwh)Gas(kg)2000407.1223.6363.613.72001408.2209.6392.513.12002415.8156.0445.816.32003472.7187.8488.220.22004509.8167.6546.222.22005537.4154.1586.820.82006579.4169.9610.815.22007613.5169.1651.116.82008620.4148.4...

4-13ELASTICITYCOEFFICIENTOFENERGYCONSUMPTION(2000-2014)ItemGrowthofEnergyGrowthofElectricityGrowthofGrossConsumptionConsumptionDomesticProduct(GDP)overthePreviousYearoverthePreviousYearoverthePreviousYear20006.089.5311.820012.065.6811.720024.899.5411.520034.785.7111.1200410.5710.6014.120057.4411.1612.120066.929.1613.020076.459.0...

4-14ENERGYCONSUMPTIONPER10000YUANOFGROSSDOMESTICPRODUCT(2001-2014)ItemTotalCoalElectricity(tonofSCE)(ton)(kwh)20011.200.771127.9120021.130.661108.0920031.060.631053.8320041.030.591021.6520050.990.551012.86(0.79)(0.44)(813.60)20060.750.39786.0120070.700.33748.7420080.640.28719.8420090.610.25700.0320100.580.22694.69(0.49)(0.19)(58...

4-12CONSUMPTIONOFTOTALENERGYANDMAINENERGYVARIETIESItemTotalEnergyConsumptionCoal(10000tonsofSCE)Total6831.221736.54Agriculture,Forestry,AnimalProductionandHunting,Fishing91.6934.88MiningandQuarrying22.211.90MiningandWashingofCoal5.530.94ExtractionofPetroleumandNaturalGas0.01MiningofFerrousMetalOres15.220.93MiningofNon-ferrousMet...

4-11CONSUMPTIONOFTOTALENERGYANDMAINENERGYVARIETIESItemTotalEnergyConsumptionCoal(10000tonsofSCE)Total6723.892019.23Agriculture,Forestry,AnimalProductionandHunting,Fishing97.3141.41MiningandQuarrying22.042.10MiningandWashingofCoal6.171.00ExtractionofPetroleumandNaturalGas0.01MiningofFerrousMetalOres13.431.05MiningofNon-ferrousMet...

4-10ENERGYBALANCE(STANDARDVOLUME)(SIMPLEEDITION)(2014)ItemTotalCoalWashedOtherCoalCoalWashedProductsCoalTotalEnergyAvailableforLocal6818.291384.274.970.011.72ConsumptionInput(-)orOutput(+)inProce-83.45-782.66-4.900.54-ssingandTransformationThermalPower-450.07-0.37Heating-94.52-327.52-8.61WashingofCoal-0.11-5.074.96CokingOilRefin...

4-7ENERGYBALANCE(PHYSICALVOLUME)(SIMPLEEDITION)(2013)ItemCoalWashedOtherCoalCoalWashedProductsCoalTotalEnergyAvailableforLocal2011.063.843.67ConsumptionInput(-)orOutput(+)inProcesing-1158.55-3.840.16andConversionThermalPower-631.97-0.93Heating-512.10-17.47WashingofCoal-14.478.50CokingOilRefiningandCoaltoLiquidOilProductRe-input(...
![[城市房价]北京市房价趋势分析报告(2025年4月版)-西城区](https://yunshufang001.oss-cn-shenzhen.aliyuncs.com/convert/202505/23/798767/thumb-P1-0950daa9-da49-415b-8cb6-8e3e8d0406f1-320x453.webp) [城市房价]北京市房价趋势分析报告(2025年4月版)-西城区11927页
[城市房价]北京市房价趋势分析报告(2025年4月版)-西城区11927页![[小区点评]胜古南里(北京朝阳)小区居住环境竞争力评级及房价趋势分析报告(2024版)](https://yunshufang001.oss-cn-shenzhen.aliyuncs.com/convert/202508/21/743778/thumb-P1-65381ca8-000b-4af7-98ba-9bb502def2f7-320x453.webp) [小区点评]胜古南里(北京朝阳)小区居住环境竞争力评级及房价趋势分析报告(2024版)8658页
[小区点评]胜古南里(北京朝阳)小区居住环境竞争力评级及房价趋势分析报告(2024版)8658页 河南统计年鉴2016_ 2602114页
![[专精特新]上海新平精细化学品有限公司行业竞争力评级分析报告(2023版)](https://yunshufang001.oss-cn-shenzhen.aliyuncs.com/convert/202509/13/633989/thumb-P1-8b2cf305-38af-4176-aac4-8478d028156f-320x453.webp) [专精特新]上海新平精细化学品有限公司行业竞争力评级分析报告(2023版)8112页
[专精特新]上海新平精细化学品有限公司行业竞争力评级分析报告(2023版)8112页 《特色田园乡村建设指南》836页
![[小区点评]麓湖路3号大院(越秀区)住宅小区居住环境竞争力评级及房价趋势分析报告(2024版)](https://yunshufang001.oss-cn-shenzhen.aliyuncs.com/convert/202505/27/670991/thumb-P1-1e538d71-11a4-48be-b182-b951c310816b-320x453.webp) [小区点评]麓湖路3号大院(越秀区)住宅小区居住环境竞争力评级及房价趋势分析报告(2024版)857页
[小区点评]麓湖路3号大院(越秀区)住宅小区居住环境竞争力评级及房价趋势分析报告(2024版)857页![[小区点评]百合山庄(龙岗区)小区居住环境竞争力评级及房价趋势分析报告(2024版)](https://yunshufang001.oss-cn-shenzhen.aliyuncs.com/convert/202505/28/679483/thumb-P1-64e2c313-39e4-42a4-b577-1efb00d82e09-320x453.webp) [小区点评]百合山庄(龙岗区)小区居住环境竞争力评级及房价趋势分析报告(2024版)859页
[小区点评]百合山庄(龙岗区)小区居住环境竞争力评级及房价趋势分析报告(2024版)859页![[小区点评]东方明珠城(龙岗区)小区居住环境竞争力评级及房价趋势分析报告(2024版)](https://yunshufang001.oss-cn-shenzhen.aliyuncs.com/convert/202505/28/681400/thumb-P1-7f09a123-caf6-42ee-8e91-cce7a101d4c7-320x453.webp) [小区点评]东方明珠城(龙岗区)小区居住环境竞争力评级及房价趋势分析报告(2024版)859页
[小区点评]东方明珠城(龙岗区)小区居住环境竞争力评级及房价趋势分析报告(2024版)859页![[小区点评]安亭中央公园(公寓住宅)(上海嘉定)小区居住环境竞争力评级及房价趋势分析报告(2024版)](https://yunshufang001.oss-cn-shenzhen.aliyuncs.com/convert/202505/29/718371/thumb-P1-58d22179-470a-425d-8267-9244fb675378-320x453.webp) [小区点评]安亭中央公园(公寓住宅)(上海嘉定)小区居住环境竞争力评级及房价趋势分析报告(2024版)1330335页
[小区点评]安亭中央公园(公寓住宅)(上海嘉定)小区居住环境竞争力评级及房价趋势分析报告(2024版)1330335页![[小区点评]彩电宿舍(北京海淀)小区居住环境竞争力评级及房价趋势分析报告(2024版)](https://yunshufang001.oss-cn-shenzhen.aliyuncs.com/convert/202508/21/743782/thumb-P1-fd567665-baa0-475a-a568-3e957c84efda-320x453.webp) [小区点评]彩电宿舍(北京海淀)小区居住环境竞争力评级及房价趋势分析报告(2024版)66257页
[小区点评]彩电宿舍(北京海淀)小区居住环境竞争力评级及房价趋势分析报告(2024版)66257页![[小区点评]中旅国际公馆(一期)(福田区)小区居住环境竞争力评级及房价趋势分析报告(2024版)](https://yunshufang001.oss-cn-shenzhen.aliyuncs.com/convert/202505/28/678791/thumb-P1-f13d2f31-eec0-4128-99a5-2c06341846b7-320x453.webp) [小区点评]中旅国际公馆(一期)(福田区)小区居住环境竞争力评级及房价趋势分析报告(2024版)1860页
[小区点评]中旅国际公馆(一期)(福田区)小区居住环境竞争力评级及房价趋势分析报告(2024版)1860页![[小区点评]江南水乡(温州市瑞安市)小区居住环境竞争力评级及房价趋势分析报告(2024版)](https://yunshufang001.oss-cn-shenzhen.aliyuncs.com/convert/202502/21/774729/thumb-P1-36fe475d-af8a-44cf-861e-e34aee034fc5-320x453.webp) [小区点评]江南水乡(温州市瑞安市)小区居住环境竞争力评级及房价趋势分析报告(2024版)7163页
[小区点评]江南水乡(温州市瑞安市)小区居住环境竞争力评级及房价趋势分析报告(2024版)7163页![[小区点评]首开熙悦山澜庭(北京房山)小区居住环境竞争力评级及房价趋势分析报告(2024版)](https://yunshufang001.oss-cn-shenzhen.aliyuncs.com/convert/202508/21/746761/thumb-P1-722d5750-8202-429b-9d38-ee5b554e4236-320x453.webp) [小区点评]首开熙悦山澜庭(北京房山)小区居住环境竞争力评级及房价趋势分析报告(2024版)11958页
[小区点评]首开熙悦山澜庭(北京房山)小区居住环境竞争力评级及房价趋势分析报告(2024版)11958页 走向共同富裕的解决相对贫困思路研究_檀学文30317页
 GB_T 25499-2010 城市污水再生利用 绿地灌溉水质379页
 IPO招股书_ 诺诚健华IPO:诺诚健华首次公开发行股票并上市招股说明书51393页
 云南经济普查年鉴2013_ C-D2-B-08-1501页
![[推荐国标] GB_T 15555.12-1995 固体废物 腐蚀性测定 玻璃电极法](https://yunshufang001.oss-cn-shenzhen.aliyuncs.com/202305/28/201617/P1-aea9b913-a8a3-458c-ad83-08bb04d8b1a2.png) [推荐国标] GB_T 15555.12-1995 固体废物 腐蚀性测定 玻璃电极法174页
[推荐国标] GB_T 15555.12-1995 固体废物 腐蚀性测定 玻璃电极法174页![[专精特新]保山恒丰纺织科技有限公司行业竞争力评级分析报告(2023版)](https://yunshufang001.oss-cn-shenzhen.aliyuncs.com/convert/202506/14/652179/thumb-P1-dbc376c9-8756-467a-939d-798b0894c83d-320x453.webp) [专精特新]保山恒丰纺织科技有限公司行业竞争力评级分析报告(2023版)9126页[小区点评]胜古南里(北京朝阳)小区居住环境竞争力评级及房价趋势分析报告(2024版)8658页
[专精特新]保山恒丰纺织科技有限公司行业竞争力评级分析报告(2023版)9126页[小区点评]胜古南里(北京朝阳)小区居住环境竞争力评级及房价趋势分析报告(2024版)8658页