3-12SEXCOMPOSITIONANDSEXRATIOOFREGISTEREDPOPULATIO(BYDISTRICT)(2014)DistrictRegisteredPopulation(10000persons)TotalMaleFemaleTotal1333.4668.3665.1CapitalCore240.9119.7121.2FunctionalAreaDongchengDistrict98.048.449.6XichengDistrict142.971.371.6UrbanFunction593.4298.8294.6ExtensionAreaChaoyangDsitrict204.2102.3101.9FengtaiDistrict...

3-11AGECOMPOSITIONOFREGISTEREDPOPULATION(2014)AgeGroupRegisteredPopulation(10000persons)Percentage(%)TotalMaleFemaleTotalMaleTotal1333.4668.3665.1100.050.10-464.433.231.24.82.55-946.824.122.63.51.810-1434.217.616.62.61.315-1948.224.224.03.61.820-2480.640.540.16.03.025-29115.558.956.68.74.430-34118.459.758.78.94.535-3984.442.741....

3-10REGISTEREDHOUSEHOLDSANDPOPULATION(BYDISTRICT)(2014DistrictRegisteredHouseholdsandPopulationHouseholds(10000households)Population(10000persons)TotalNon-AgriculturalTotalAgriculturalTotal522.6415.1107.51333.4CapitalCore82.582.5240.9FunctionalAreaDongchengDistrict34.634.698.0XichengDistrict47.947.9142.9UrbanFunction212.1198.913...

3-9REGISTEREDPOPULATION(1978-2014)YearRegisteredHouseholdsRegisteredPopulationBySex(10000Populationat60MaleFemalehouseholds)andobove1978205.5849.7432.1417.51979214.6870.6441.1429.41980223.2885.7448.4437.31981234.8900.8456.6444.21982245.0917.8465.5452.31983255.1933.2474.7458.51984263.1945.2481.2464.01985274.1957.9488.0469.9198628...

3-8FAMILYSIZEOFPERMANENTPOPULATION(2014)AreaTotalNumberPercentageofVariousSizedFamily(%)ofHouseholdsOneTwoThreeFourFivePersons(household)PersonPersonsPersonsPersonsandaboveTotal19754021.330.629.810.38.0Urban16579821.730.230.910.07.2Rural3174219.232.724.012.012.1Note:Figuresinthistablearesamplefiguresfromthesamplesurveyonpopulation.

3-7EDUCATIONATTAINMENTOFPERMANENTPOPULATION(2014(person)ItemTotalMalePopulationat6andabove541394271649PrimarySchool5796126640JuniorSecondarySchool15439383358SeniorSecondarySchool8318443418VocationalSchool3545718277JuniorCollege70316344764-yearUnversityEducation10323648244Postgraduate2555614215Note:Figuresinthistablearesamplefiguresfromthesamplesurveyonpopulation.ENTPOPULATION(2014(person)Female26974531321710353976617180358405499211341

3-6PERMANENTPOPULATIONBYAGECOMPOSITION(2014)AgeGroupPermanentPopulationPercentage(10000persons)(%)Total2151.6100.00-490.64.25-971.43.310-1451.02.415-1984.63.920-24223.710.425-29243.611.330-34229.710.735-39168.27.840-44183.68.545-49170.87.950-54161.57.555-59151.37.060-64109.35.165-6971.53.370-7449.52.375-7945.62.180-8429.31.485andabove16.40.8Note:Figuresinthistableareestimatedfiguresfromthesamplesurveyonpopulationintheendofyear.

3-5NATURALCHANGEOFPERMANENTPOPULATION(BYDISTRICT)(20DistrictNumberNumberNaturalIncreaseBirthRateofBirthsofDeathsofPopulation(person)(person)(person)(‰)Total2080901049771031139.75CapitalCore2378916224756510.75FunctionalAreaDongchengDistrict765171714808.41XichengDistrict161389053708512.39UrbanFunction9175443743480118.79ExtensionA...

3-4PERMANENTPOPULATIONDENSITY(BYDISTRICT)(2014)DistrictLandPermanentAreaPopulation(sq.km)(10000persons)Total16410.542151.6CapitalCore92.39221.3FunctionalAreaDongchengDistrict41.8691.1XichengDistrict50.53130.2UrbanFunction1275.931055.0ExtensionAreaChaoyangDistrict455.08392.2FengtaiDistrict305.80230.0ShijingshanDistrict84.3265.0Ha...

3-3TOTALNUMBEROFPERMANENTPOPULATION(BYDISTRICT)(2014)(10000persons)DistrictPermanentPopulationPermanentUrbanMigrantPopulationPopulationTotal2151.6818.71859.0CoreFuntionalArea221.354.0221.3oftheCapitalDongchengDistrict91.121.291.1XichengDistrict130.232.8130.2UrbanFunction1055.0436.41043.1ExtensionAreaChaoyangDistrict392.2179.8389...

3-2PERMANENTPOPULATION(1978-2014)YearPermanentBySexByUrbanAreaandPopulationPermanentRuralArea(10000MigrantMaleFemaleUrbanpersons)PopulationPopulation1978871.521.8443.2428.3479.01979897.126.5454.6442.5510.31980904.318.6457.8446.5521.11981919.218.4465.9453.3533.31982935.017.2474.0461.0544.01983950.016.8483.0467.0557.01984965.019.8...

3-1BASICSTATISTICSONPOPULATIONCENSUSIN1953,1964,1982,1990Item19531964PermanentPopulation(10000persons)276.8759.7BySexMale159.8391.1Female117.0368.6SexRatio(Female=100)136.5106.1ByUrbanAreaandRuralAreaUrbanPopulation205.8425.8RuralPopulation71.0333.9AverageFamilySize(person/household)CompositionbyAgeGroup(%)Age0-1430.141.5Age15-5...

2-18IMPETUSOFTHREEINDUSTRIESTOGDPGROWTH(2001-2014)(PercentageYearGrossDomesticPrimarySecondaryTertiaryProductIndustryIndustryIndustry200111.70.13.18.5200211.50.12.78.7200311.1…3.77.4200414.1…5.38.8200512.1…3.28.9200613.0…3.19.9200714.5…3.610.920089.1…0.28.9200910.2…2.77.5201010.3…3.56.820118.1…1.66.520127.7…1.85.920137...

2-16OVERALLLABORPRODUCTIVITY(1978-2014)(yuan/person)YearOverallLaborPrimarySecondaryTertiaryProductivityIndustryIndustryIndustry1978250444444841911197926264214556203319802914510475023911981279556143162420198229598784437246719833368109447992998198439091287534736461985458016716040426819865002193263314783198756692569691755011988704...

2-17CONTRIBUTIONRATEOFTHREEINDUSTRIESTOTHEINCREASEOFGDP(2001-2014)GrossYearDomesticPrimarySecondaryTertiaryProductIndustryIndustryIndustry2001100.00.826.772.52002100.00.523.476.12003100.0-0.233.466.82004100.0-0.137.962.22005100.0-0.326.973.42006100.00.123.576.42007100.00.224.974.92008100.00.12.497.52009100.00.426.573.12010100.0-...

2-15HOUSEHOLDSCONSUMPTIONLEVEL(1978-2014)YearLevel(yuan)Uban/RuralIndex(1978=100)ConsumptionAllUrbanRuralRatio(RuralAllHouseholdsHouseholdsHouseholdsHouseholds=1)Households19783304511852.4100.019793564642212.1117.519804405622802.0147.619814855903381.7160.319825266223841.6170.619835796744321.6175.419846777894941.6201.419859121101...

2-13GROSSDOMESTICPRODUCTBYEXPENDITUREAPPROACH(100millionyuan)Item20142013GrossDomesticProduct21330.819800.8FinalConsumptionExpenditure13329.212148.2HouseholdsConsumption7691.67099.9UrbanResident7094.66563.5RuralResident597.0536.4GovernmentConsumption5637.65048.3GrossCapitalFormation8309.47989.6CompletedFixedAsset7957.27712.3Chan...

2-14CONTRIBUTIONOFTHREEDEMANDSTOGROWTHOFGDP(2001-20YearFinalConsumptionExpenditureGrossCapitalFormationContributionImpetusContributionImpetusRate(%)(PercentagePoints)Rate(%)(PercentagePoints)200132.43.843.25.1200277.08.861.67.1200340.74.566.37.4200440.25.737.35.3200537.24.545.75.5200660.07.824.63.2200761.18.921.03.0200881.67.49....
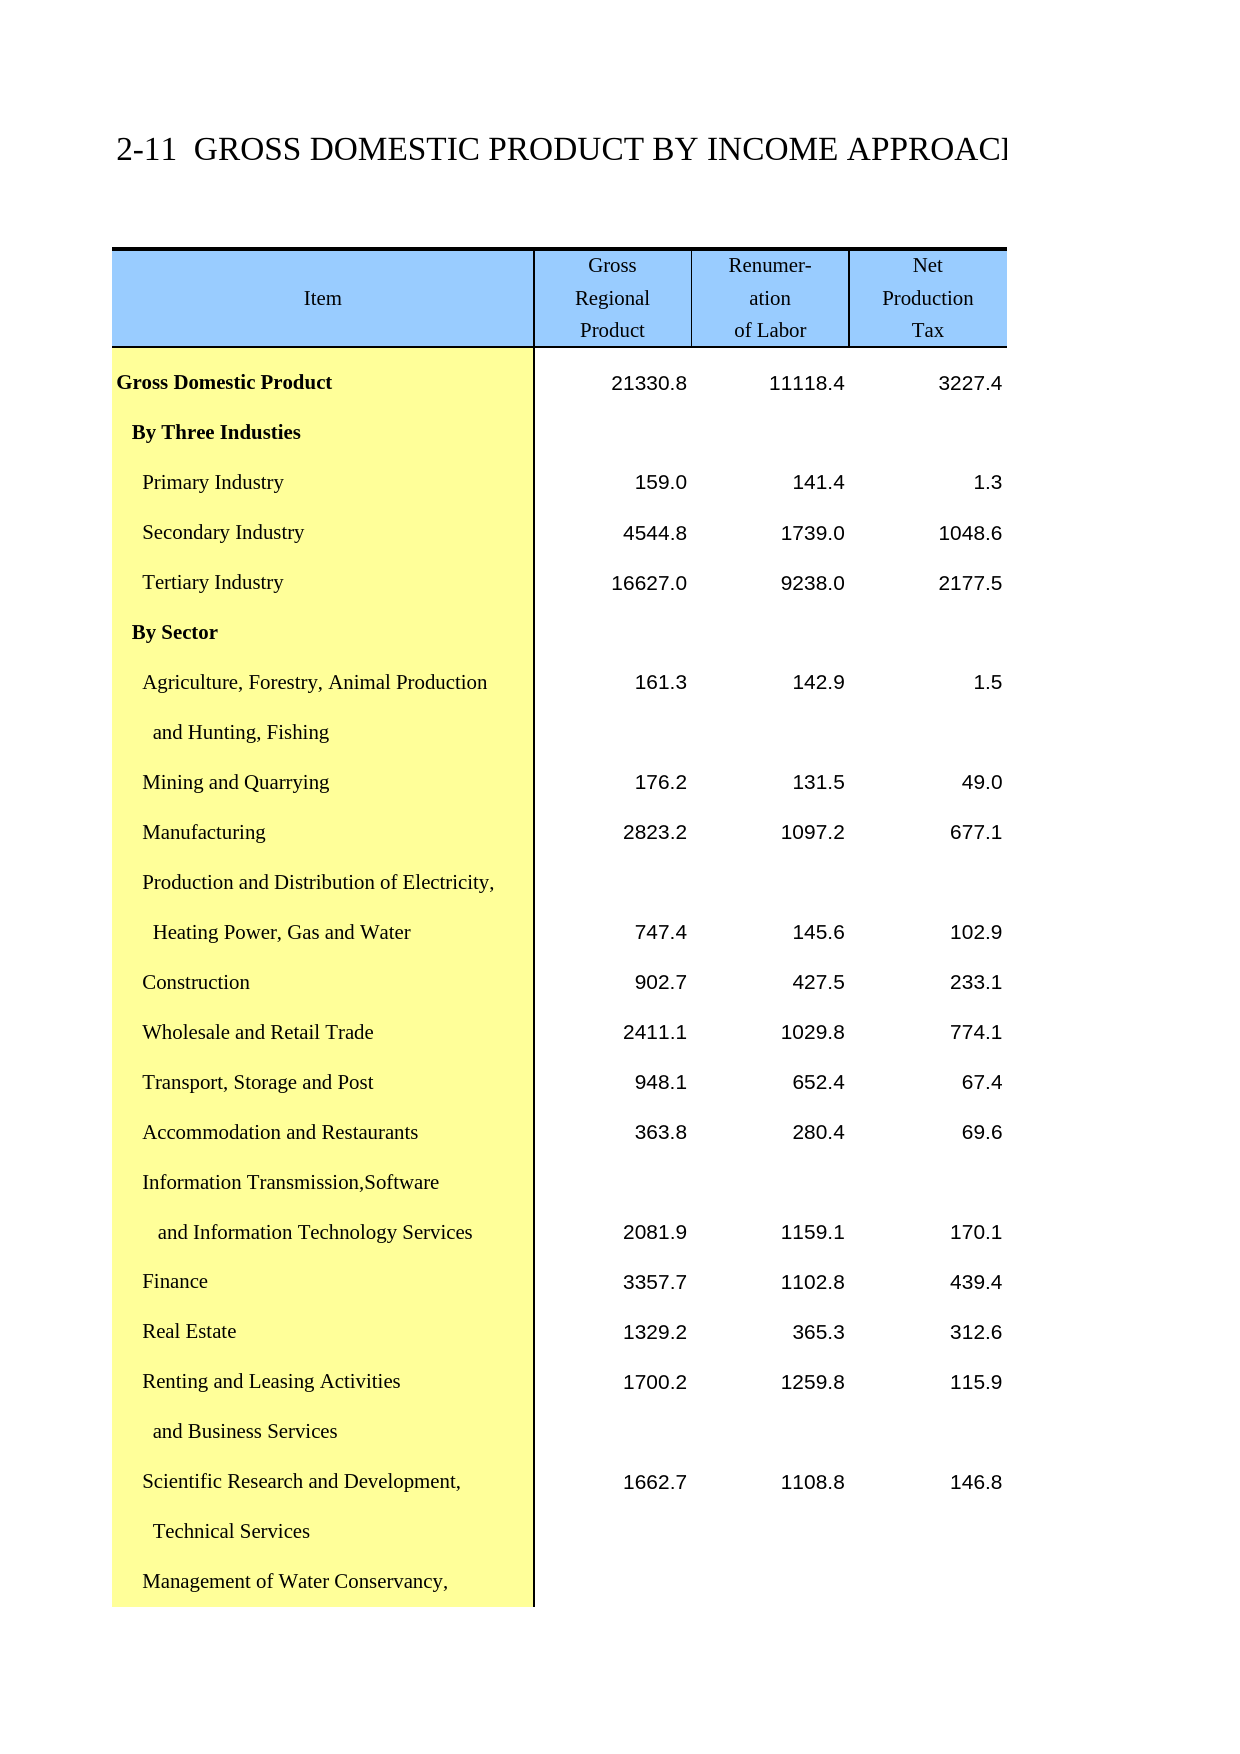
2-11GROSSDOMESTICPRODUCTBYINCOMEAPPROACH(2014)(100milliItemGrossRenumer-NetRegionalationProductionProductofLaborTaxGrossDomesticProduct21330.811118.43227.4ByThreeIndustiesPrimaryIndustry159.0141.41.3SecondaryIndustry4544.81739.01048.6TertiaryIndustry16627.09238.02177.5BySectorAgriculture,Forestry,AnimalProduction161.3142.91.5and...

2-10GROSSDOMESTICPRODUCTBYINCOMEAPPROACH(2013)(100ItemGrossRenumer-NetRegionalationProductionProductofLaborTaxGrossDomesticProduct19800.810238.63179.8ByThreeIndustiesPrimaryIndustry159.6141.31.2SecondaryIndustry4292.61676.5989.4TertiaryIndustry15348.68420.82189.2BySectorAgriculture,Forestry,AnimalProduction161.8142.71.5andHuntin...
![[城市房价]北京市房价趋势分析报告(2025年4月版)-西城区](https://yunshufang001.oss-cn-shenzhen.aliyuncs.com/convert/202505/23/798767/thumb-P1-0950daa9-da49-415b-8cb6-8e3e8d0406f1-320x453.webp) [城市房价]北京市房价趋势分析报告(2025年4月版)-西城区11927页
[城市房价]北京市房价趋势分析报告(2025年4月版)-西城区11927页![[小区点评]胜古南里(北京朝阳)小区居住环境竞争力评级及房价趋势分析报告(2024版)](https://yunshufang001.oss-cn-shenzhen.aliyuncs.com/convert/202508/21/743778/thumb-P1-65381ca8-000b-4af7-98ba-9bb502def2f7-320x453.webp) [小区点评]胜古南里(北京朝阳)小区居住环境竞争力评级及房价趋势分析报告(2024版)8658页
[小区点评]胜古南里(北京朝阳)小区居住环境竞争力评级及房价趋势分析报告(2024版)8658页 河南统计年鉴2016_ 2602114页
![[专精特新]上海新平精细化学品有限公司行业竞争力评级分析报告(2023版)](https://yunshufang001.oss-cn-shenzhen.aliyuncs.com/convert/202509/13/633989/thumb-P1-8b2cf305-38af-4176-aac4-8478d028156f-320x453.webp) [专精特新]上海新平精细化学品有限公司行业竞争力评级分析报告(2023版)8112页
[专精特新]上海新平精细化学品有限公司行业竞争力评级分析报告(2023版)8112页 《特色田园乡村建设指南》836页
![[小区点评]麓湖路3号大院(越秀区)住宅小区居住环境竞争力评级及房价趋势分析报告(2024版)](https://yunshufang001.oss-cn-shenzhen.aliyuncs.com/convert/202505/27/670991/thumb-P1-1e538d71-11a4-48be-b182-b951c310816b-320x453.webp) [小区点评]麓湖路3号大院(越秀区)住宅小区居住环境竞争力评级及房价趋势分析报告(2024版)857页
[小区点评]麓湖路3号大院(越秀区)住宅小区居住环境竞争力评级及房价趋势分析报告(2024版)857页![[小区点评]百合山庄(龙岗区)小区居住环境竞争力评级及房价趋势分析报告(2024版)](https://yunshufang001.oss-cn-shenzhen.aliyuncs.com/convert/202505/28/679483/thumb-P1-64e2c313-39e4-42a4-b577-1efb00d82e09-320x453.webp) [小区点评]百合山庄(龙岗区)小区居住环境竞争力评级及房价趋势分析报告(2024版)859页
[小区点评]百合山庄(龙岗区)小区居住环境竞争力评级及房价趋势分析报告(2024版)859页![[小区点评]东方明珠城(龙岗区)小区居住环境竞争力评级及房价趋势分析报告(2024版)](https://yunshufang001.oss-cn-shenzhen.aliyuncs.com/convert/202505/28/681400/thumb-P1-7f09a123-caf6-42ee-8e91-cce7a101d4c7-320x453.webp) [小区点评]东方明珠城(龙岗区)小区居住环境竞争力评级及房价趋势分析报告(2024版)859页
[小区点评]东方明珠城(龙岗区)小区居住环境竞争力评级及房价趋势分析报告(2024版)859页![[小区点评]安亭中央公园(公寓住宅)(上海嘉定)小区居住环境竞争力评级及房价趋势分析报告(2024版)](https://yunshufang001.oss-cn-shenzhen.aliyuncs.com/convert/202505/29/718371/thumb-P1-58d22179-470a-425d-8267-9244fb675378-320x453.webp) [小区点评]安亭中央公园(公寓住宅)(上海嘉定)小区居住环境竞争力评级及房价趋势分析报告(2024版)1330335页
[小区点评]安亭中央公园(公寓住宅)(上海嘉定)小区居住环境竞争力评级及房价趋势分析报告(2024版)1330335页![[小区点评]彩电宿舍(北京海淀)小区居住环境竞争力评级及房价趋势分析报告(2024版)](https://yunshufang001.oss-cn-shenzhen.aliyuncs.com/convert/202508/21/743782/thumb-P1-fd567665-baa0-475a-a568-3e957c84efda-320x453.webp) [小区点评]彩电宿舍(北京海淀)小区居住环境竞争力评级及房价趋势分析报告(2024版)66257页
[小区点评]彩电宿舍(北京海淀)小区居住环境竞争力评级及房价趋势分析报告(2024版)66257页![[小区点评]中旅国际公馆(一期)(福田区)小区居住环境竞争力评级及房价趋势分析报告(2024版)](https://yunshufang001.oss-cn-shenzhen.aliyuncs.com/convert/202505/28/678791/thumb-P1-f13d2f31-eec0-4128-99a5-2c06341846b7-320x453.webp) [小区点评]中旅国际公馆(一期)(福田区)小区居住环境竞争力评级及房价趋势分析报告(2024版)1860页
[小区点评]中旅国际公馆(一期)(福田区)小区居住环境竞争力评级及房价趋势分析报告(2024版)1860页![[小区点评]江南水乡(温州市瑞安市)小区居住环境竞争力评级及房价趋势分析报告(2024版)](https://yunshufang001.oss-cn-shenzhen.aliyuncs.com/convert/202502/21/774729/thumb-P1-36fe475d-af8a-44cf-861e-e34aee034fc5-320x453.webp) [小区点评]江南水乡(温州市瑞安市)小区居住环境竞争力评级及房价趋势分析报告(2024版)7163页
[小区点评]江南水乡(温州市瑞安市)小区居住环境竞争力评级及房价趋势分析报告(2024版)7163页![[小区点评]首开熙悦山澜庭(北京房山)小区居住环境竞争力评级及房价趋势分析报告(2024版)](https://yunshufang001.oss-cn-shenzhen.aliyuncs.com/convert/202508/21/746761/thumb-P1-722d5750-8202-429b-9d38-ee5b554e4236-320x453.webp) [小区点评]首开熙悦山澜庭(北京房山)小区居住环境竞争力评级及房价趋势分析报告(2024版)11958页
[小区点评]首开熙悦山澜庭(北京房山)小区居住环境竞争力评级及房价趋势分析报告(2024版)11958页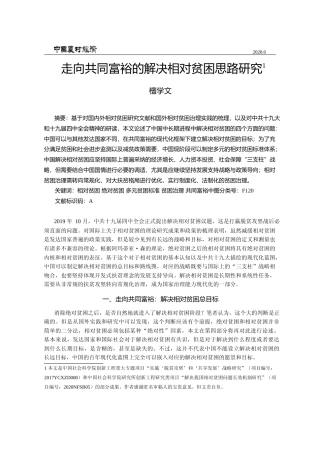 走向共同富裕的解决相对贫困思路研究_檀学文30317页
 GB_T 25499-2010 城市污水再生利用 绿地灌溉水质379页
 IPO招股书_ 诺诚健华IPO:诺诚健华首次公开发行股票并上市招股说明书51393页
 云南经济普查年鉴2013_ C-D2-B-08-1501页
![[推荐国标] GB_T 15555.12-1995 固体废物 腐蚀性测定 玻璃电极法](https://yunshufang001.oss-cn-shenzhen.aliyuncs.com/202305/28/201617/P1-aea9b913-a8a3-458c-ad83-08bb04d8b1a2.png) [推荐国标] GB_T 15555.12-1995 固体废物 腐蚀性测定 玻璃电极法174页
[推荐国标] GB_T 15555.12-1995 固体废物 腐蚀性测定 玻璃电极法174页![[专精特新]保山恒丰纺织科技有限公司行业竞争力评级分析报告(2023版)](https://yunshufang001.oss-cn-shenzhen.aliyuncs.com/convert/202506/14/652179/thumb-P1-dbc376c9-8756-467a-939d-798b0894c83d-320x453.webp) [专精特新]保山恒丰纺织科技有限公司行业竞争力评级分析报告(2023版)9126页[小区点评]胜古南里(北京朝阳)小区居住环境竞争力评级及房价趋势分析报告(2024版)8658页
[专精特新]保山恒丰纺织科技有限公司行业竞争力评级分析报告(2023版)9126页[小区点评]胜古南里(北京朝阳)小区居住环境竞争力评级及房价趋势分析报告(2024版)8658页